
AP Syllabus focus: 'A simple linear regression model uses an explanatory variable, x, to predict the response variable, y.'
Linear regression lets statisticians summarize a linear pattern between two quantitative variables and use that pattern to estimate likely response values from known explanatory-variable values.
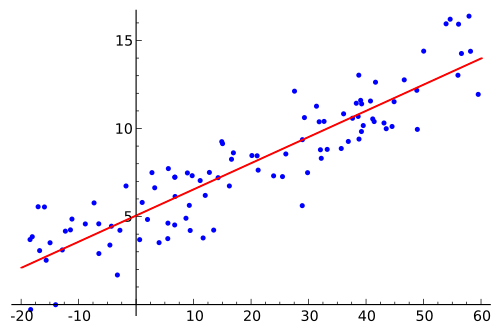
This scatterplot shows paired quantitative data points together with a fitted regression line. The vertical “scatter” around the line illustrates that individual observations typically do not fall exactly on the model, even when the overall relationship is approximately linear. Source
What a simple linear regression model does
A simple linear regression model is used when there are two quantitative variables and the goal is to predict one of them from the other. The variable used as the input is the explanatory variable, written as . The variable being predicted is the response variable, written as .
Simple linear regression model: A model that uses one explanatory variable, , to estimate or predict a response variable, , with a straight-line relationship.
The word simple matters. It means the model uses only one explanatory variable. In AP Statistics, this model is designed to describe a roughly linear relationship, so the predictions come from a straight line rather than from a curve or from separate category averages.
When a regression model is used, it does not claim that every observed value falls exactly on the line. Instead, it captures the overall pattern in the data and gives a best estimate of the response for each possible value of . That is why regression is useful for prediction: once the line is fitted, each input value has a corresponding predicted output value.
How the model represents prediction
A regression model is usually written as an equation. This equation gives the predicted response, not the actual response, for a chosen value of the explanatory variable.
= predicted value of the response variable
= constant term in the regression model
= coefficient of the explanatory variable in the regression model
= value of the explanatory variable
In this notation, is read as “y-hat.” It represents the model’s prediction. The actual observed response is still written as . This distinction is essential because a model prediction is an estimate based on a trend, while an observed value comes from a real individual or case in the data set.
Predicted response: The estimated value of the response variable produced by the regression model for a given explanatory-variable value.
A prediction from the regression line should be understood as a likely or expected response for that value of . Actual observations may be above or below the line, even when the model is useful.
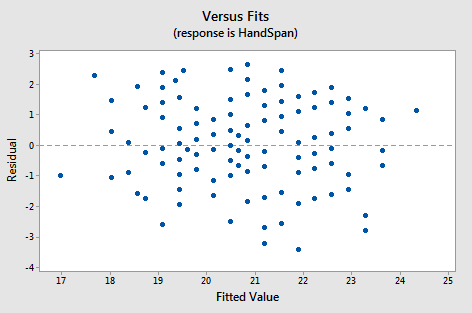
This residual plot graphs residuals (observed minus predicted ) against fitted values, with a reference line at 0. A roughly patternless cloud around 0 indicates that the linear model is capturing the main trend and that the remaining errors look like random variation. Source
In other words, regression does not remove variability; it provides a structured way to estimate a response despite that variability.
Choosing and using the variables correctly
To use a simple linear regression model correctly, the roles of the variables must make sense in context. The explanatory variable should be the variable used to explain, forecast, or help account for changes in the response variable. The response variable is the outcome being predicted.
This direction matters. A model that predicts test score from hours studied answers a different question from a model that predicts hours studied from test score. Even when the same two variables are involved, the prediction goal determines which variable is treated as and which is treated as .
Because regression is a prediction tool, the predicted value should always be stated in context. A good statistical statement names the response variable and includes its units. A prediction is not just a number; it is a predicted height, price, score, or time, depending on the situation.
It is also important that both variables be quantitative. A simple linear regression model is not used when the variables are categorical. In this topic, the model is specifically about using numeric input values to produce numeric response predictions.
What makes a prediction meaningful
A regression prediction is most meaningful when the data show a reasonably linear pattern. If the relationship is not close to linear, a straight-line model may not represent the association well, and the predictions may be less useful.
Even when the pattern is linear, the prediction should be seen as an estimate of a typical response rather than a guaranteed result for a specific individual. Two observations can have the same explanatory value and still have different response values. The model gives one predicted value because it summarizes the overall pattern with a single straight line.
This is one reason regression is powerful in statistics. It allows a large set of paired observations to be condensed into a clear predictive rule. Instead of treating each point separately, the model uses the shared linear trend to connect the variables in a way that supports estimation.
In AP Statistics, technology is commonly used to produce the regression equation from data. Once the model has been obtained, it becomes a tool for prediction, but the prediction still depends on how well the line reflects the observed relationship.
What regression prediction does not imply
Using a linear regression model to predict responses does not mean the model gives exact answers. It gives estimated values based on a linear association in observed data. The real response for an individual case may differ from the predicted response.
A regression prediction also does not automatically establish cause and effect. The fact that is used to predict does not prove that changing causes to change. Prediction and causation are different ideas.
Finally, a regression model should be interpreted as a statistical description of a relationship, not as a perfect rule. Its value lies in giving a reasonable predicted response from an explanatory variable, which is the central purpose of simple linear regression in AP Statistics.
Practice Questions
A nutritionist fits a simple linear regression model to predict daily water intake, (ounces), from outdoor temperature, (degrees Fahrenheit).
What does it mean to say that the model uses to predict ? [2 marks]
1 mark for identifying temperature as the explanatory or input variable and water intake as the response or output variable.
1 mark for stating that the model gives an estimated or predicted water intake for a given temperature, not an exact observed value.
A school counselor uses a simple linear regression model to predict final exam score, , from number of class absences, . The regression equation is .
(a) Find the predicted final exam score for a student with 4 absences.
(b) Explain what your answer in part (a) means in context.
(c) Explain why a student with 4 absences might not have exactly the predicted score.
(d) Does this model prove that each additional absence causes a student’s exam score to drop by 2.8 points? Explain. [5 marks]
(a) 1 mark for .
(b) 1 mark for stating that is the predicted or estimated final exam score for a student with 4 absences.
(c) 1 mark for explaining that actual exam scores vary and the regression line gives an estimate, not an exact value.
(d) 1 mark for answering no.
(d) 1 mark for explaining that regression shows a predictive relationship or association, not proof of causation.
FAQ
$\hat{y}$ shows that the value comes from a model rather than from direct observation.
Using different notation helps distinguish:
$y$, an actual recorded response
$\hat{y}$, the response predicted by the regression line
That distinction becomes important whenever you compare what the model says to what actually happened.
Yes. Because the model is a mathematical line, it can produce values that do not make sense in context, such as a negative time or a score above the maximum possible.
When that happens, check:
whether the linear model is reasonable for the situation
whether the prediction is being made for unrealistic values of $x$
whether the response variable has natural limits the line ignores
A usable model must make sense both statistically and contextually.
A regression model is directional. Predicting $y$ from $x$ is not the same as predicting $x$ from $y$.
The reason is that the model is built to use one variable as the input and the other as the output. Changing that direction changes the statistical task, so the fitted line will usually change as well.
That is why choosing the explanatory variable carefully matters before using a regression model for prediction.
The model still gives only one predicted value, $\hat{y}$, for that particular $x$ value.
That single prediction represents the center of the overall linear pattern at that input value, not every possible observed response.
So, if many individuals share the same $x$ but have different outcomes, the regression line gives a typical predicted response rather than a full list of possible responses.
This usually happens because calculators store more decimal places than the rounded equation shown on the screen.
For example:
the displayed slope and intercept may be rounded
the calculator may use the unrounded values internally
hand calculations based on rounded coefficients can produce a slightly different $\hat{y}$
On AP Statistics work, small differences caused by rounding are usually acceptable if the method is correct and the answer is reasonable.
