
AP Syllabus focus: 'Extrapolation predicts a response using an explanatory-variable value beyond those used to determine the regression line, making predictions less reliable farther away.'
Linear regression is useful for prediction, but not every prediction should be trusted equally. AP Statistics expects you to recognize when a predicted value goes beyond the observed data and why that matters.
What Extrapolation Means
When a regression model is used, the line is based only on the values of the explanatory variable that were actually observed in the data set. A prediction made for an x-value inside that observed range is supported directly by data. A prediction made outside that range extends the pattern beyond where it was measured.
This kind of prediction is called extrapolation.
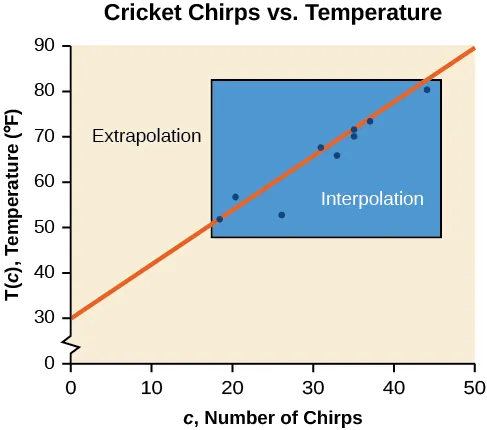
A scatterplot with a fitted line is shown, with the observed x-range boxed and labeled as interpolation, while predictions made beyond that box are labeled as extrapolation. The visual emphasizes that extrapolation is identified by an -value outside the data’s observed range, even though the regression line can be extended algebraically. Source
Extrapolation: Using a regression line or other model to predict a response for an explanatory-variable value that is outside the range of observed explanatory values.
Extrapolation is not automatically impossible, but it is less reliable than prediction within the data range. The farther the new x-value is from the observed x-values, the less support the data give for the prediction.
Why Extrapolation Is Risky
A regression line summarizes the pattern seen in the original data. It does not prove that the same pattern will continue forever. Outside the observed range, several problems can occur:
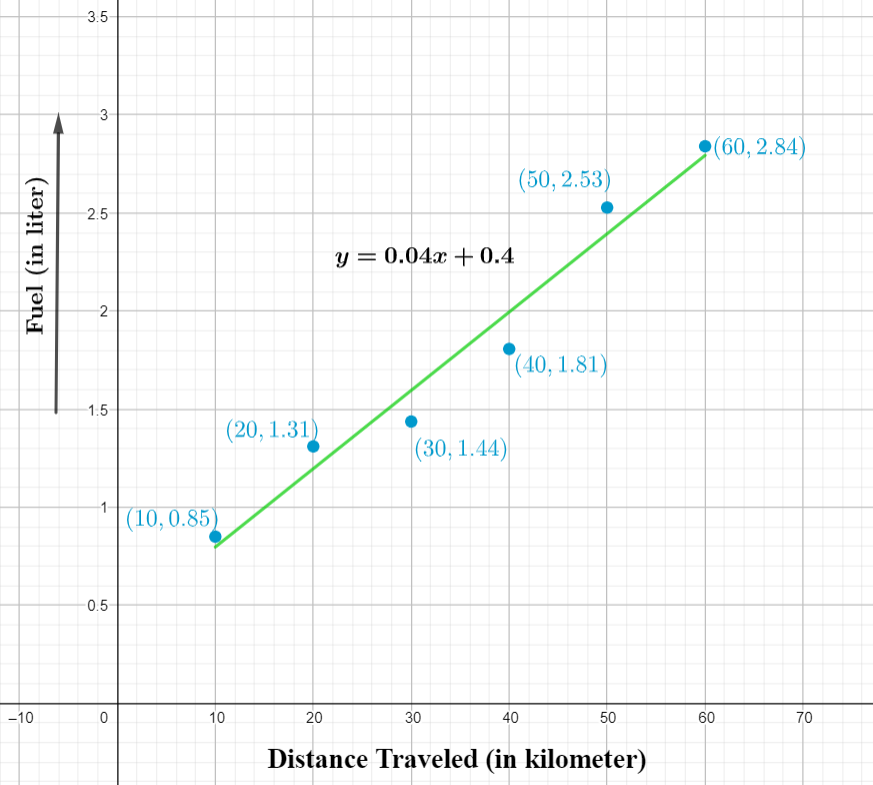
A simple line graph illustrates extending a linear trend past the last observed point to estimate values in an unobserved region. The diagram highlights the core idea that extrapolation relies on an assumption that the same linear pattern continues beyond the measured data. Source
The relationship may change form. A pattern that looks linear over a limited interval may later curve, level off, or reverse.
New conditions may matter beyond the data range. Variables that were unimportant in the sample may become important farther away.
The model may produce values that are unreasonable in context, even if the algebra works perfectly.
Small estimation errors in the line can become much larger prediction errors when the line is extended well beyond the data.
This is why AP Statistics emphasizes that extrapolated predictions become less reliable farther away from the observed x-values. Distance matters because the model is being asked to continue a trend that the data never actually confirmed.
The Observed Range Matters
To decide whether a prediction is extrapolation, look at the smallest and largest observed values of the explanatory variable. If the new x-value is below the minimum or above the maximum, the prediction is an extrapolation.
What matters is the range of the explanatory variable, not the response variable. Students sometimes focus on whether the predicted y-value seems unusually large or small, but the formal issue is whether the input x-value lies outside the data used to create the regression line.
A prediction at an x-value just barely outside the data range is still extrapolation. However, a prediction far beyond the data is generally more risky than one just past the nearest observed value. On the AP exam, phrases such as outside the scope of the data or beyond the range of observed x-values communicate this clearly.
Prediction Reliability
Another important idea is prediction reliability.
Prediction reliability: The degree to which a model-based prediction is supported by the data used to create the model.
For this subsubtopic, reliability is not about whether the arithmetic is correct. You can substitute an x-value into a regression equation and compute a result exactly, but the prediction can still be weak if it relies on extrapolation. A calculated prediction is not always a trustworthy prediction.
Reliability is strongest when the new x-value is well represented by nearby observed x-values. Reliability weakens when the model must stretch beyond the available evidence.
How to Judge a Prediction
When you are asked to evaluate a prediction, your response should do more than say “yes” or “no.” A strong AP Statistics explanation usually includes these ideas:
Identify whether the x-value is within or outside the observed range.
If it is outside, state that the prediction is an extrapolation.
Explain that the regression line was fitted using data only from the observed range.
State that predictions become less reliable farther away because the pattern may not continue.
If context is provided, connect your explanation to the setting. In many real situations, growth, cost, or physical measurements cannot continue at the same linear rate indefinitely. Context strengthens the statistical reasoning.
Practical Warning Signs
Certain situations should make you especially cautious about extrapolation:
The observed data cover only a narrow range of x-values.
The prediction is far beyond the largest or smallest observed x-value.
The setting suggests a limit, threshold, or change in behavior.
The predicted response would be impossible or unreasonable in context.
These warning signs do not require new calculations. They require judgment about how models behave and how evidence supports prediction.
Common Mistakes
Several common errors appear in student work:
Assuming a prediction is reliable simply because a regression equation is available.
Treating an observed straight-line trend as proof that the trend will continue outside the data.
Forgetting that extrapolation is determined by the x-value, not by whether the predicted y-value looks unusual.
Giving only the word extrapolation without explaining why reliability is lower.
Believing that a prediction outside the data range is just as trustworthy as one made within the range.
Practice Questions
A least-squares regression line was created using data on weekly exercise time for values of from to hours. A student uses the line to predict resting heart rate for a person who exercises hours per week.
State whether this prediction is an extrapolation, and explain why it is less reliable.
1 mark: Identifies that this is extrapolation.
1 mark: Explains that is outside the observed x-range of to , so the regression line is being used beyond the data and the pattern may not continue.
A company records the age of a machine, in years, and its yearly maintenance cost for machines between and years old. A linear regression model is used to predict maintenance cost.
(a) Explain whether using the model to predict maintenance cost for a machine that is years old is extrapolation.
(b) Explain whether using the model to predict maintenance cost for a machine that is years old is extrapolation.
(c) Give two reasons why the prediction for a -year-old machine should be treated cautiously.
(d) A student says, “The calculator produced a numerical answer, so the prediction must be valid.” Explain why this reasoning is incomplete.
(a) 1 mark: States that this is not extrapolation because is within the observed x-range of to .
(b) 1 mark: States that this is extrapolation because is outside the observed x-range.
(c) 2 marks: Any two valid reasons, such as:
the model was fitted only using data from to years;
the linear pattern may not continue for older machines;
predictions become less reliable farther beyond the data range;
other factors may affect maintenance cost for much older machines.
(d) 1 mark: Explains that a calculator can evaluate the equation algebraically for any x-value, but that does not guarantee the prediction is statistically reliable.
FAQ
No. In real applications, people sometimes use short-range extrapolation when no in-range data are available.
However, it should be described as tentative, not certain. Strong subject-matter knowledge is usually needed to justify it, and the risk should be acknowledged clearly.
There is no universal cutoff.
It depends on factors such as:
how far the new x-value is from the nearest observed value;
whether the process is expected to stay stable;
whether the setting has natural limits or change points.
A tiny step beyond the data is still extrapolation, but it is usually less risky than a large jump.
Technology follows the equation, not the context.
If a regression line has already been computed, software can substitute any x-value into that line. It does not automatically decide whether the x-value is reasonable or whether the prediction is supported by data. That judgment is the statistician’s job.
Not by itself.
A large data set can improve how well the model is estimated within the observed range. But even thousands of observations do not confirm what happens outside that range. Extrapolation depends on missing evidence, not just on sample size.
The best option is usually to collect data in the range where prediction is needed.
If that is not possible, the researcher can:
restrict claims to the observed range;
state clearly that the result is an extrapolated estimate;
use subject-matter knowledge to judge whether extending the trend is plausible.
Careful wording is important when evidence is limited.
