
AP Syllabus focus: 'A residual is the actual value minus the predicted value. A residual plot graphs residuals against explanatory values or predicted response values.'
Residuals connect observed data to regression predictions. By learning how to compute and graph them, you can describe prediction errors clearly and understand what each data point contributes to a fitted model.
What a Residual Measures
A regression model gives a predicted response for each observed explanatory value. The difference between what actually happened and what the model predicted is called a residual. Residuals turn a fitted model into a set of individual prediction errors, one for each observation.
Residual: The difference between an observed response value and the value predicted by a regression model.
A residual keeps the original sign of the difference, so it shows both size and direction. That makes it more informative than simply saying how far a point is from the regression line.
= residual, in response-variable units
= actual response value
= predicted response value
Because the subtraction is actual minus predicted, the sign has a clear meaning.
If , the observed response is above the model’s prediction.
If , the observed response is below the model’s prediction.
If , the model predicted the response exactly for that observation.
How to Calculate a Residual
To compute a residual, start with one observed data pair. Use the regression equation to find the predicted response for that explanatory value. Then subtract the predicted value from the actual observed response. Every observation in the data set has its own residual.
When calculating residuals, keep these ideas in mind:
Use the observed response value in the subtraction, not the explanatory value.
Keep the negative sign if the predicted value is larger than the actual value.
Report the residual in the same units as the response variable.
A larger residual in magnitude means a larger prediction error for that observation.
Residuals connect the scatterplot to the regression line. A point very close to the line has a residual near , while a point farther from the line has a residual with larger magnitude. This makes residuals a practical way to compare how well the model predicts different observations without changing the original data values.
Residual Plots
Once residuals have been computed, they are usually graphed rather than listed one by one. A residual plot is the standard graph for displaying those residuals.
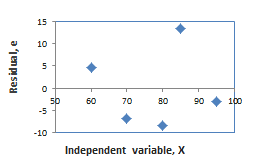
Residual plots graph residuals on the vertical axis against the explanatory variable on the horizontal axis, with a reference line at marking no prediction error. Random scatter around suggests a linear model is reasonable, while systematic shapes (like curves or a funnel) indicate violations such as nonlinearity or nonconstant variance. Source
Residual plot: A graph of residuals against explanatory variable values or against predicted response values.
A residual plot does not show the original response values on the vertical axis. Instead, it shows the prediction errors. This is important because it shifts attention from the original relationship to how far observations fall above or below the model’s predictions.
What Goes on Each Axis?
In AP Statistics, the vertical axis of a residual plot is the residual, often centered around a horizontal reference line at . The horizontal axis is either:
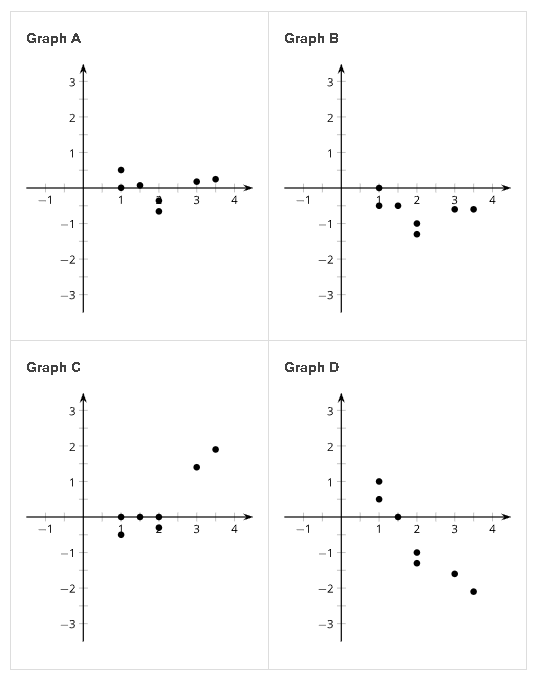
Each mini-graph is a residual plot: the horizontal coordinate is an -value (explanatory value) and the vertical coordinate is the residual. Points near correspond to observations the model predicts well, while points farther from 0 indicate larger errors. Source
the explanatory variable value, giving points of the form , or
the predicted response value, giving points of the form .
Both versions use the same residuals. The only change is what appears on the horizontal axis. In either form, points above the line represent positive residuals, and points below the line represent negative residuals.
How to Read a Point on a Residual Plot
Each point on a residual plot corresponds to one observation from the original data set. Its vertical position shows the size and direction of that observation’s residual.
A point near the line represents a small prediction error.
A point far above the line represents a large positive residual.
A point far below the line represents a large negative residual.
Because the original response values are not on the vertical axis, a residual plot should not be read like a scatterplot of versus . It is a graph of errors, not a graph of the original data relationship.
Why Plotting Residuals Helps
A list of residuals can be hard to interpret quickly, especially with many observations. A plot makes it easier to see where prediction errors occur and whether some observations have much larger errors than others. It also makes comparisons easier across the range of explanatory values or across the range of predicted values.
This matters because two observations can have similar explanatory values but very different residuals. A residual plot displays those differences clearly without requiring the full original scatterplot or a long list of numbers.
Common Mistakes to Avoid
Students often make a few predictable errors when working with residuals.
Reversing the subtraction: residuals are actual minus predicted, not predicted minus actual.
Using the wrong vertical axis: a residual plot uses residuals, not original response values.
Dropping the sign: a negative residual is meaningful and should stay negative.
Confusing residual with distance: residuals include direction, so they are not just nonnegative amounts.
Using the wrong horizontal coordinate: for this course, residual plots are described against explanatory values or predicted response values.
AP Exam Tips
On free-response questions, use precise language. State whether a residual is positive, negative, or zero, and connect that sign to whether the model underpredicted or overpredicted the response. If asked to plot a point on a residual plot, give the correct horizontal coordinate and the residual as the vertical coordinate. Careful notation with , , and helps prevent sign errors.
Practice Questions
For one observation, the actual response value is and the predicted response value is .
(a) Find the residual.
(b) Does the model overpredict or underpredict for this observation?
1 mark: Computes the residual correctly: .
1 mark: States that the model overpredicts, because the predicted value is greater than the actual value or because the residual is negative.
A regression model predicting quiz score from study time is , where is hours of study.
A student studied hours and scored on the quiz.
Another student studied hours and has a residual of .
(a) Calculate the residual for the student who studied hours. (2 marks)
(b) On a residual plot with study time on the horizontal axis, what point represents the first student? (1 mark)
(c) For the second student, state whether the model overpredicts or underpredicts the quiz score, and explain what the residual tells you about the student’s actual score compared with the predicted score. (2 marks)
Part (a)
1 mark: Finds the predicted score for : .
1 mark: Finds the residual: .
Part (b)
1 mark: Gives the point .
Part (c)
1 mark: States that the model overpredicts.
1 mark: Explains that the actual score is points below the predicted score.
FAQ
This sign convention makes interpretation consistent with the graph of the data.
A positive residual means the observed point is above the regression prediction, and a negative residual means it is below. If the subtraction were reversed, that visual meaning would reverse too and make interpretation less intuitive.
A residual is based on data you actually observed and on the regression line you actually fitted.
An error term is a theoretical idea: it represents how far a population value is from the true regression relationship. In practice, we can calculate residuals directly, but the true error term is usually unknown.
Both versions display the same residuals, so both show the same vertical deviations from the model.
Plotting against predicted values organizes the errors by the fitted responses rather than by the original $x$-values. In simple linear regression, the two displays are closely related, but software may prefer one format over the other.
Vertical stacking happens when multiple observations share the same horizontal coordinate.
That can occur if several cases have the same explanatory value, or if several fitted values are identical after rounding. The points can still have different residuals, so the stack shows multiple observations at that same horizontal position.
If you use a rounded predicted value to compute a residual, your answer may differ slightly from the software’s stored value.
This is normal. The software often keeps many more decimal places internally than it displays on the screen. When possible, use stored regression calculations rather than rounded display values to avoid small discrepancies.
