
AP Syllabus focus: 'Apparent randomness in a residual plot supports a linear form, and residual plots help investigate whether a selected model is appropriate.'
Residual plots help you judge whether a fitted model is doing its job. In AP Statistics, they are mainly used to decide whether a linear model leaves only random leftover variation.
Why Residual Plots Matter
A fitted model can look reasonable when drawn on top of a scatterplot, but the original graph may hide important problems. A residual plot separates the leftover variation from the main trend, making it easier to see whether the model has captured the overall pattern in the data.
Residual plots are especially valuable because a good model should remove structure. After the model has explained the relationship as well as it can, the remaining residuals should not show a pattern of their own. If a pattern remains, the model has missed something important.
Residual plots help reveal whether the unexplained part of the data still contains structure.
Residual plot: A graph of model residuals used to assess whether the remaining variation appears random and whether a selected model is appropriate.
In this subsubtopic, the key idea is apparent randomness.

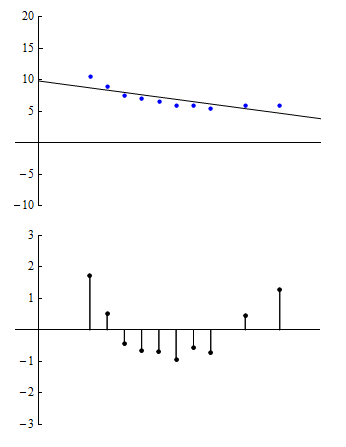
A residual plot for a linear regression where the residuals appear randomly scattered around the zero line. This “no clear pattern” look is the visual evidence that the linear model has captured the main trend, leaving mostly random leftover variation. In AP Statistics terms, this supports using a linear form for the relationship. Source
A residual plot does not need to look perfect. Instead, it should look like an unorganized cloud of points rather than a shape, trend, or repeated pattern.
What Apparent Randomness Looks Like
Features That Support a Linear Form
A residual plot supports a linear form when the points:
are scattered with no obvious curve
appear above and below the horizontal zero line
do not show a steady upward or downward trend
do not break into distinct shapes or sections
show roughly similar vertical spread across the plot
When these features are present, the residuals behave like random noise. That suggests the linear model has captured the main relationship between the variables, so using a linear form is reasonable.
A common AP Statistics interpretation is: the residual plot shows no clear pattern, so a linear model is appropriate. The important part is the link between the random-looking residuals and the decision about model choice.
Why Randomness Matters
A linear model is intended to explain a straight-line trend. If it has done that successfully, there should be no systematic leftover behavior. Residuals should not continue to bend, drift, or spread in a structured way. In other words, the residual plot checks the part of the relationship the model did not explain.
This is why residual plots are more than simple pictures. They are evidence about whether a selected model matches the data well enough for interpretation and prediction.
Patterns That Suggest the Model Is Not Appropriate
Curved Patterns
If the residual plot shows a curve, such as a U-shape or an upside-down U-shape, the points are not random.
An example where the residual plot forms a distinct U-shape instead of a random cloud. This curvature indicates systematic structure left in the residuals, meaning a straight-line model is missing an important bend in the relationship. The appropriate response is to question the linear model and consider a curvilinear alternative. Source
This means the relationship in the original data is not being described well by a straight line. A linear model misses the bend in the data, so it is not appropriate.
Trends Across the Plot
If residuals tend to be mostly positive in one region and mostly negative in another, the plot shows a systematic trend rather than randomness. That indicates the model consistently overpredicts in some places and underpredicts in others. A model with this kind of behavior is not fully capturing the relationship.
Changing Spread
Sometimes the residuals do not form a curve, but their spread gets wider or narrower across the plot. This fan-shaped pattern suggests the amount of prediction error changes for different values of the explanatory variable. Even if the center of the plot looks roughly flat, the lack of random spread raises concern about whether the selected model is equally appropriate across all values.
Large Isolated Residuals
A point far from the rest of the residuals shows that the model fits that observation poorly. One unusual residual does not automatically invalidate the model, but it should make you cautious. If a few points stand out strongly, the model may not describe the data consistently.
How to Assess a Model Using a Residual Plot
Questions to Ask
When reading a residual plot, ask:
Do the points look randomly scattered?
Is there any obvious curve or shape?
Is there a pattern from left to right?
Is the spread fairly similar throughout the plot?
Are there unusual residuals that stand out strongly?
These questions focus on the same decision: does the plot look random enough to support the chosen model?
If the answer is yes, the model is supported. If the answer is no, the model should be questioned.
What “Appropriate” Means Here
In AP Statistics, saying a model is appropriate does not mean it is perfect. It means the residual plot gives no strong evidence against the model. Apparent randomness supports using the model because no additional structure is visible in the leftover variation.
This is an important distinction. A random-looking residual plot supports a linear model, but it does not prove that the model is exact or that every prediction will be accurate. It simply means the residual plot does not reveal a clear problem with the model’s form.
Language to Use on the Exam
Strong exam responses usually connect the visual pattern to the modeling decision. Useful wording includes:
“The residual plot shows apparent randomness, so a linear model is appropriate.”
“The residual plot shows a clear curved pattern, so a linear model is not appropriate.”
“Because the residuals are not randomly scattered, the selected model does not appear to fit the data well.”
Good interpretations name the pattern and then state what that pattern implies about model appropriateness.
Practice Questions
A residual plot for a fitted linear model shows points scattered randomly above and below 0 with no clear pattern. What does this suggest about the model? [2 marks]
States that the residual plot shows apparent randomness or no clear pattern. (1)
Concludes that a linear model is appropriate or reasonable for the data. (1)
A student fits a linear model to a set of data. The residual plot shows a clear U-shaped pattern. Another student fits a different linear model to another data set, and the residual plot shows no curve but the residuals spread out more as the explanatory variable increases.
For each student, assess whether the linear model is appropriate and justify your answer using the residual plot. [5 marks]
Identifies the U-shaped pattern as nonrandom. (1)
Concludes that the first linear model is not appropriate. (1)
Justifies that the model missed structure in the relationship. (1)
Identifies the increasing spread in the second residual plot. (1)
Concludes that the second linear model is not fully appropriate, or that its fit is less reliable across the range of the explanatory variable, because the residuals do not show consistent random spread. (1)
FAQ
A scatterplot still contains the full trend of the data, so your eye may focus on the overall direction and miss smaller issues.
A residual plot removes that main trend and leaves only the unexplained part. Curves, changing spread, or repeated shifts often become much easier to notice when the overall pattern has been stripped away.
Both are common, and both can be useful.
In simple linear regression, plotting residuals against the explanatory variable is often the most direct choice because it shows whether problems appear across the x-values. Plotting residuals against predicted values can also help, especially when checking whether the spread changes as predicted responses get larger. In many AP Statistics settings, either display gives similar information about model fit.
With a small data set, a real pattern may be hard to detect because there are too few points to show it clearly.
With a large data set, even subtle structure may become visible. That means interpretation requires judgment:
small samples can hide problems
large samples can reveal tiny but real departures
you should look for meaningful overall structure, not just isolated coincidences
Yes. If the original data were recorded only to the nearest whole number or nearest tenth, residuals can fall into visible bands or stripes.
That kind of pattern does not always mean the model form is wrong. Sometimes it reflects how the data were measured rather than how the variables are related. If a residual plot looks strangely layered, think about the measurement process before deciding the model itself is the problem.
A random residual plot has scatter without a systematic shape. A messy plot may look noisy at first, but still hide a pattern.
Look for structure such as:
an arch or U-shape
a fan pattern
long stretches where residuals stay mostly above or below 0
The key question is not whether the plot is untidy. The key question is whether the untidiness is organized in a way that suggests the model missed something.
