
AP Syllabus focus:
‘Identify questions suggested by variation in the shapes of distributions of samples taken from the same population.
- Understand that variation in shapes of data distributions may be due to random or non-random causes. This includes recognizing and analyzing the reasons behind the variability in data distributions and how this variability can impact statistical conclusions and inferences.’
Sample distributions vary naturally, and understanding why this variation occurs is essential for making reliable statistical inferences. This topic explores how random and non-random factors influence distribution shapes.
Understanding Variation in Sample Distributions
Variation in the shapes of sample distributions is a central idea in statistics because it highlights that different samples from the same population rarely look identical. Even when every requirement for proper sampling is met, sample-to-sample differences arise. These differences prompt important questions about how data behave and how confidently we can generalize findings.
What Is a Sample Distribution?
A sample distribution is the distribution of observed values within a single sample drawn from a population. Its shape, center, and spread offer clues about both the underlying population and the sampling process.
Sample Distribution: The distribution of data values collected from one sample, representing a subset of a larger population.
Understanding this distribution is foundational because it reflects the randomness inherent in sampling and helps identify patterns worth investigating.
Questions Suggested by Variation in Distribution Shapes
According to the syllabus, students must be able to identify questions suggested by variation in the shapes of distributions from multiple samples of the same population. Such questions help determine whether observed features are meaningful or simply due to chance.
Common Investigative Questions
When comparing several sample distributions, students should consider:
Why do the shapes differ?
Does variability reflect sampling randomness, or does it indicate a systematic pattern?Is one sample unusually skewed or peaked?
Could this reveal a rare sampling outcome or a problem in how data were collected?Do differences affect conclusions?
Would summary statistics or inferences change depending on which sample is examined?
These questions guide a deeper understanding of how distributions vary and why that matters for valid inference.
Random Causes of Variation
Much variation seen across sample distributions results from random sampling variation, the natural fluctuation that occurs because samples include different individuals each time. Random causes are expected and follow from the statistical principles underlying sampling.
Characteristics of Random Variation
Random variation typically shows:
Differences in shape, center, or spread that are not extreme.
Changes that diminish as sample size increases.
Patterns that reflect the overall population distribution without persistent anomalies.
Random sampling creates natural, chance-based differences in sample distributions, even when all samples come from the same population.
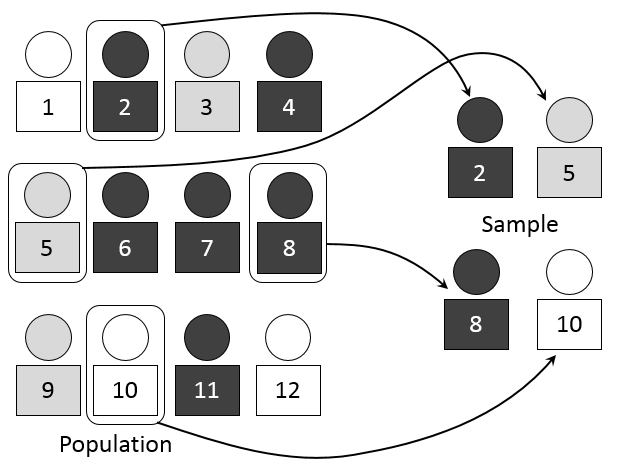
A schematic illustrating how a simple random sample is drawn from a larger population, showing how random selection leads to natural variation between samples. Source.
Random Sampling Variation: Natural differences between samples that arise solely due to chance when selecting individuals from a population.
After considering this definition, it becomes clear that random variability is not an error; rather, it is an inherent component of statistical work and motivates the use of probability models.
Non-Random Causes of Variation
The syllabus emphasizes that variation may also result from non-random causes, which require careful analysis because they suggest issues beyond mere chance.
Sources of Non-Random Variation
Non-random variation may arise from:
Biased sampling methods, such as convenience or voluntary response sampling.
Poor data collection procedures, including measurement errors or inconsistent survey administration.
Population changes, meaning the population is not stable across samples.
Non-Random Variation: Differences in sample distributions caused by systematic factors rather than chance, often indicating bias or methodological flaws.
This type of variation is especially important because it can distort conclusions, misrepresent populations, and lead to inaccurate inferences.
Why Variation Matters for Statistical Conclusions
Variation in sample distributions directly influences the reliability of statistical inferences. If variation is large or appears systematic, confidence in claims about the population diminishes. Conversely, if variation is small and attributable to random causes, inferences become more trustworthy.
How Variation Impacts Inference
Key impacts include:
Effect on generalizability: Greater sample variation suggests less certainty that sample results represent the population accurately.
Influence on sampling distributions: Understanding variation helps determine whether statistical procedures relying on distributional assumptions are appropriate.
Potential for misleading conclusions: Non-random variation can produce faulty estimations of population characteristics.
These impacts highlight why recognizing the source of variation is essential before drawing any conclusions from data.
Distinguishing Between Random and Non-Random Causes
Students must be able to tell whether variation reflects chance or something systematic. This distinction shapes next steps in statistical reasoning.
Strategies for Distinguishing Causes
To differentiate random from non-random variation, consider:
Sampling method: Was random sampling used? If not, non-random causes are likely.
Repetition: Do repeated samples display consistent unusual patterns? Persistent anomalies suggest systematic influences.
Each sample can be displayed with a dotplot or histogram to reveal its overall shape, center, and spread.
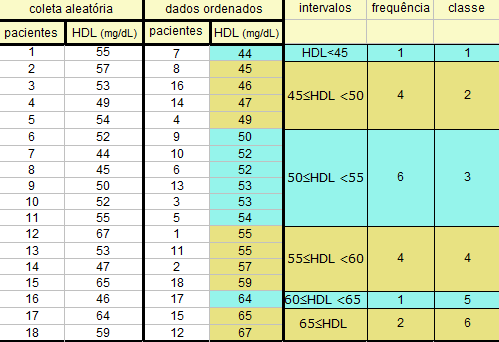
A histogram illustrating how sample data can be grouped into intervals to reveal distribution shape, including any clustering or skewness present in a single sample. Source.
Contextual knowledge: Background information about the population may reveal non-random factors affecting results.
By systematically evaluating these aspects, students gain the reasoning skills necessary to judge when sample variation signals meaningful concerns.
As sample size increases, the sampling distributions of summary statistics such as the sample mean tend to become less variable and more tightly clustered.
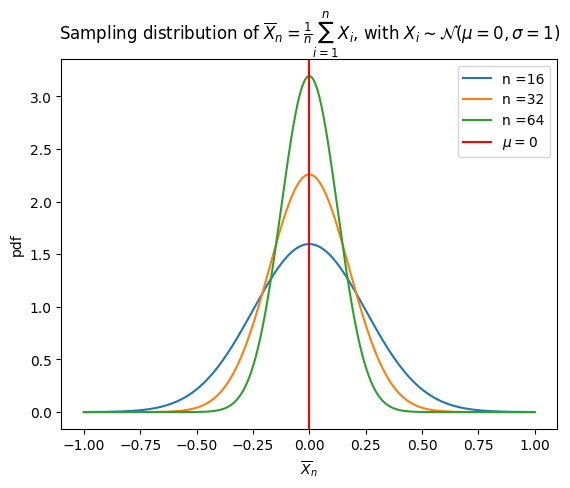
A set of sampling distributions for different sample sizes, showing that repeated sampling produces distributions centered at the same mean but with decreasing spread as sample size increases. Source.
FAQ
Smaller samples tend to show greater fluctuations in shape because each individual observation has a larger impact on the overall distribution. This makes features such as skewness or peaks more pronounced from sample to sample.
As sample size increases, shapes become more stable and more closely resemble the population’s distribution, even though random variation never fully disappears.
Yes, especially when samples are small or the population itself has high variability.
Extreme outcomes may appear in one sample but not another, creating noticeable differences in symmetry, spread, or clustering. Such differences are still compatible with correct sampling and do not imply an error unless they occur consistently.
Non-random causes may be suspected if:
• The same unusual shape appears repeatedly across independently collected samples.
• The pattern contradicts known characteristics of the population.
• There is evidence of bias in the sampling process, such as selective inclusion or measurement inconsistencies.
Differences in shape help illustrate how much estimates can change from sample to sample.
This variation provides insight into the reliability of statistical conclusions and highlights the role of chance. Observing shape variation helps students recognise which patterns are expected variability and which may warrant further investigation.
Contextual knowledge provides expectations about what reasonable variation should look like.
For example, if a population is known to be symmetric, repeated strongly skewed sample distributions may suggest a methodological issue. Conversely, if a population is naturally skewed, observing occasional unusually symmetric samples can still be attributed to chance.
Practice Questions
Question 1 (1–3 marks)
A researcher takes two random samples from the same population. The first sample’s distribution appears roughly symmetric, while the second sample’s distribution is noticeably right-skewed.
(a) Give one reason why these two sample distributions may look different.
(b) State whether this difference necessarily suggests a problem with the sampling method. Explain briefly.
Question 1 (1–3 marks)
(a)
• 1 mark: States that random sampling variation can cause samples from the same population to look different.
(b)
• 1 mark: States that the difference does not necessarily indicate a sampling problem.
• 1 mark: Provides a correct explanation, such as the difference being expected due to chance, especially with smaller samples.
Question 2 (4–6 marks)
A teacher asks each student in a class to simulate drawing multiple random samples of size 40 from the same population. The resulting sample distributions vary noticeably in shape, with some showing slight skewness and others appearing almost uniform.
(a) Explain why the shapes of these sample distributions differ, even though all samples come from the same population.
(b) Identify one question a statistician might ask when observing this variation in shapes.
(c) Describe how a non-random cause could create atypical variation in the sample distributions, and outline one sign that such a cause may be present.
Question 2 (4–6 marks)
(a)
• 1 mark: Identifies random sampling variation as the cause.
• 1 mark: Explains that different individuals may be selected in each sample, creating different shapes.
• 1 mark: Notes that even with consistent methods, variation is natural.
(b)
• 1 mark: Provides a valid investigative question, for example:
Is the observed skewness due to chance or a systematic issue?
Could one sample be unusually extreme compared with others?
Does the variation affect the conclusions drawn?
(c)
• 1 mark: Describes a legitimate non-random cause such as bias in data collection, measurement errors, or a flawed sampling process.
• 1 mark: Gives a clear sign of such an issue, e.g., consistent skewness in repeated samples, patterns that do not resemble the population, or anomalies that persist across replications.
