
AP Syllabus focus:
‘Parameters and probabilities for a sampling distribution of the difference between sample means should be contextualized with appropriate units and considered within the specific settings of the populations being studied. This involves understanding the implications of the mean and standard deviation of the sampling distribution for making inferences about the population means' difference.’
Understanding how to interpret probabilities and parameters for the sampling distribution of the difference between sample means is essential for drawing meaningful, context-specific inferences about population differences.
Interpreting Parameters in the Sampling Distribution of the Difference Between Sample Means
When comparing two populations, the statistic of interest is often the difference between sample means, written as .
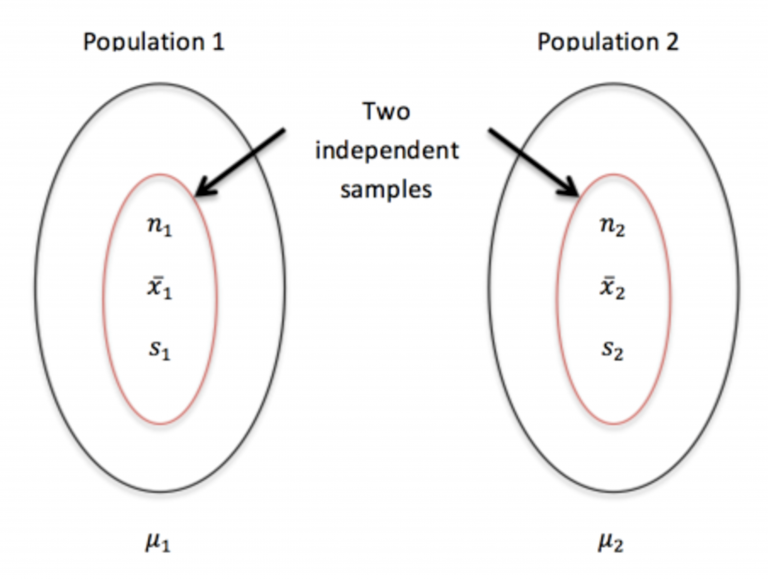
This diagram shows two independent populations, each with its own population mean and a sample summarized by its size, mean, and standard deviation, helping illustrate the structure of comparing sample means. Source.
The mean of the sampling distribution, also called the expected difference in sample means, describes the long-run average of all possible differences between samples of the same sizes. This value connects directly to the true population difference, , and sets the baseline for interpreting sample outcomes.
Parameter (Population): A fixed numerical value describing a characteristic of a population, such as a mean or difference in means.
Because these parameters are tied to specific populations, every interpretation must be expressed with appropriate units (such as points, minutes, grams, dollars) and tied to the particular measurement being compared.
A normal sentence ensures smooth flow before presenting an equation that formalizes the mean of this sampling distribution.
EQUATION
= Population means (units depend on context)
Understanding the Standard Deviation of the Sampling Distribution
The standard deviation of the sampling distribution of , often called the standard error of the difference, measures how much the statistic varies across repeated samples. Interpreting this parameter requires linking the variability back to the context of the underlying populations.
Standard Error: The standard deviation of a sampling distribution, describing typical variation in a sample statistic across repeated samples.
Students should recognize that standard error reflects how much random sampling alone might cause sample differences to fluctuate, even when the population difference stays fixed. This interpretation must always reference the scale of the variable and the sample sizes involved.
A descriptive sentence ensures clarity before the equation that expresses standard error mathematically.
EQUATION
= Population standard deviations (units match the variable)
= Sample sizes (unitless counts)
Interpreting Probabilities Associated with the Sampling Distribution
Interpreting probabilities requires understanding that they describe how likely certain values of are, assuming repeated sampling from the same populations under identical conditions. These probabilities must always be contextualized:
Using the correct measurement units
Referencing the difference in population means
Describing outcomes relative to the expected difference and the typical variability
In AP Statistics, correct interpretation means avoiding generic statements such as “the probability is small” and instead anchoring explanations in the real comparative scenario.
When the sampling distribution is approximately normal, which typically requires both sample sizes to be sufficiently large or both populations to be normally distributed, probabilities correspond to areas under a normal curve. These areas quantify how unusual or typical an observed difference would be if the population difference remained constant.
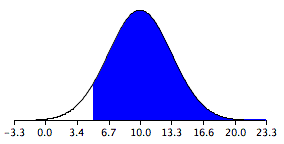
This graph illustrates a normal sampling distribution for the difference between sample means, showing how probabilities correspond to shaded areas that represent unusual or typical outcomes. Source.
Key Principles for Interpreting Probabilities
Probabilities must refer to the sampling distribution, not the population.
Statements must be clearly tied to the difference in sample means, not individual sample values.
Interpretations should specify the direction of comparison (e.g., “Population 1 minus Population 2”).
Units of measurement must always appear in interpretations.
Explanations must reflect variability from random sampling, not from measurement error or bias.
A normal sentence keeps the text connected before moving into interpretive structure.
Essential Components of a High-Quality Probability Interpretation
Context: Identify the populations and variable being compared.
Scale: Use the correct units for the mean difference.
Benchmark: Reference the population difference, , when relevant.
Variability: Connect probability statements to the standard error, explaining what is considered typical or unusual.
Directionality: Indicate whether the observed difference is greater than, less than, or equal to a comparison value.
Applying Contextual Reasoning When Interpreting Parameters
Students must avoid interpreting parameters or probabilities abstractly. Every statement should explicitly connect to the scenario, such as comparing average travel times, test scores, reaction speeds, or any measurable characteristic across two groups. Because the units and population definitions vary by context, interpretations must always specify what the numbers represent.
Integrating Units and Population Context into Interpretations
Whether discussing the expected value of or the variability captured by the standard error, interpretations must include units such as minutes, centimeters, dollars, or points. Similarly, every explanation must describe which populations the samples represent and how the difference between their means shapes the meaning of the sampling distribution.
FAQ
Always follow the order defined in the study or question prompt. The direction (for example, Brand X minus Brand Y) determines the sign of the mean difference and therefore affects interpretation.
If the order is not specified, choose one and remain consistent throughout your analysis. Clearly stating the direction avoids confusion and ensures correct contextual interpretation.
Units show what the numerical values actually represent, such as minutes, grams, or points. Without units, interpretations may become vague or misleading.
Using units also helps distinguish whether the value describes a population, a sample, or a difference between groups, supporting clarity in comparative contexts.
A probability is practically meaningful when it provides insight into how surprising or expected an observed difference is in real-world terms.
Consider:
• the size of the difference relative to typical variation
• whether such a difference would affect decisions or policies
• whether stakeholders would view the observed outcome as important, not just statistically unusual
This indicates that the observed sample difference is typical of what would occur under repeated sampling from the same two populations.
It suggests that the sample provides a realistic estimate of the true difference in population means, assuming sampling conditions were appropriate and unbiased.
Unusual differences suggest that either the observed sample was an extreme realisation of random sampling or that assumptions about the populations may not hold.
Interpretation should consider:
• how many standard errors away from the mean the value lies
• whether the sample sizes were sufficient
• whether the populations may differ more (or less) than expected based on prior information
Practice Questions
Question 1 (1–3 marks)
Researchers compare the mean concentration of a pollutant (in micrograms per litre) in two independent rivers, River A and River B. Samples of equal size are taken from each river, producing a sample mean for River A minus River B of 4.2 micrograms per litre. The sampling distribution of the difference in sample means is approximately normal with a mean equal to the true difference in population means and a standard error of 1.5 micrograms per litre.
Interpret the value 4.2 micrograms per litre in the context of this study.
Question 1 (1–3 marks)
Award up to 3 marks:
• 1 mark for identifying that 4.2 micrograms per litre is the observed difference in sample means (A minus B).
• 1 mark for stating that it is an estimate of the true population difference in mean pollutant concentration.
• 1 mark for contextual clarity, mentioning rivers and the measurement units (micrograms per litre).
Full-mark example idea:
"4.2 micrograms per litre represents the observed difference between the sample means from River A and River B and serves as an estimate of the true difference in their mean pollutant levels."
Question 2 (4–6 marks)
A nutritionist is comparing the average sugar content (in grams) of two brands of cereal, Brand X and Brand Y. Independent random samples are taken from each brand. The sampling distribution of the difference in sample means (X minus Y) is approximately normal with:
• mean equal to the true difference in population means
• standard error of 2.3 grams
An observed sample gives a difference in sample means (X minus Y) of 7.8 grams.
(a) Explain what the mean of the sampling distribution represents in the context of the cereals.
(b) Interpret the standard error of 2.3 grams in context.
(c) Comment on whether a difference of 7.8 grams would be considered typical or unusual in repeated sampling. Justify your reasoning using the information provided.
Question 2 (4–6 marks)
(a) (1–2 marks)
• 1 mark for stating that the mean of the sampling distribution equals the true population difference in means (Brand X minus Brand Y).
• 1 mark for including context (sugar content of cereals).
(b) (1–2 marks)
• 1 mark for explaining that the standard error describes the typical variation in the difference in sample means across repeated samples.
• 1 mark for contextualising this variation using grams of sugar and the two cereal brands.
(c) (2 marks)
• 1 mark for stating whether 7.8 grams is typical or unusual.
• 1 mark for justification referencing the standard error (e.g., that 7.8 is several standard errors from the mean, or that a value of that size would occur infrequently in repeated sampling).
A full-mark response would clearly reference context, the brands of cereal, and the relevant units.
