
AP Syllabus focus:
‘Introduction to the one-sample z-interval for a proportion as the suitable method for estimating a population proportion using sample data. This involves understanding the formula basis and its applicability to one categorical variable.’
The one-sample z-interval for a population proportion provides a structured method for estimating an unknown proportion using sample data, grounding inference in normal-approximation principles.
Understanding the Purpose of the One-Sample z-Interval
This subsubtopic focuses on selecting the correct interval procedure when estimating a population proportion from a single sample tied to one categorical variable. The goal is to ensure that students recognize when the one-sample z-interval is appropriate, understand its conceptual basis, and apply it only under valid conditions. This interval method is designed for proportion data—outcomes categorized as “success” or “failure.” Choosing the proper interval procedure ensures statistical conclusions are meaningful and justified.
The Nature of Proportion Data
Before selecting any interval procedure, it is essential to understand that a population proportion refers to the long-run relative frequency of a categorical outcome in a population. The one-sample z-interval uses the sample proportion to infer this unknown parameter.
Population Proportion: The true proportion of individuals in a population exhibiting a particular categorical outcome.
Because proportions come from categorical responses, the data structure must always reflect counts of successes out of a fixed number of independent trials. This requirement shapes the interval procedure that can be used.
Why the One-Sample z-Interval Is the Correct Procedure
The one-sample z-interval for a proportion is selected when the research question aims to estimate a single population proportion using only one sample. No alternative interval structure—such as a t-interval or a two-sample interval—fits this scenario. The method relies on the approximate normality of the sampling distribution of the sample proportion, p-hat, when certain conditions are met.
Core Components of the One-Sample z-Interval
Constructing a z-interval requires identifying three essential elements:
A point estimate, which is the sample proportion p-hat.
A critical value, denoted as z*, indicating the z-score associated with the desired confidence level.
A standard error, estimating the variability of the sample proportion across repeated samples of the same size.
EQUATION
Standard Error of p-hat = sqrt[(p-hat(1 − p-hat))/n]
p-hat = Sample proportion (unitless)
n = Sample size (number of observations)
These components work together to create the confidence interval by adding and subtracting the margin of error from the point estimate.
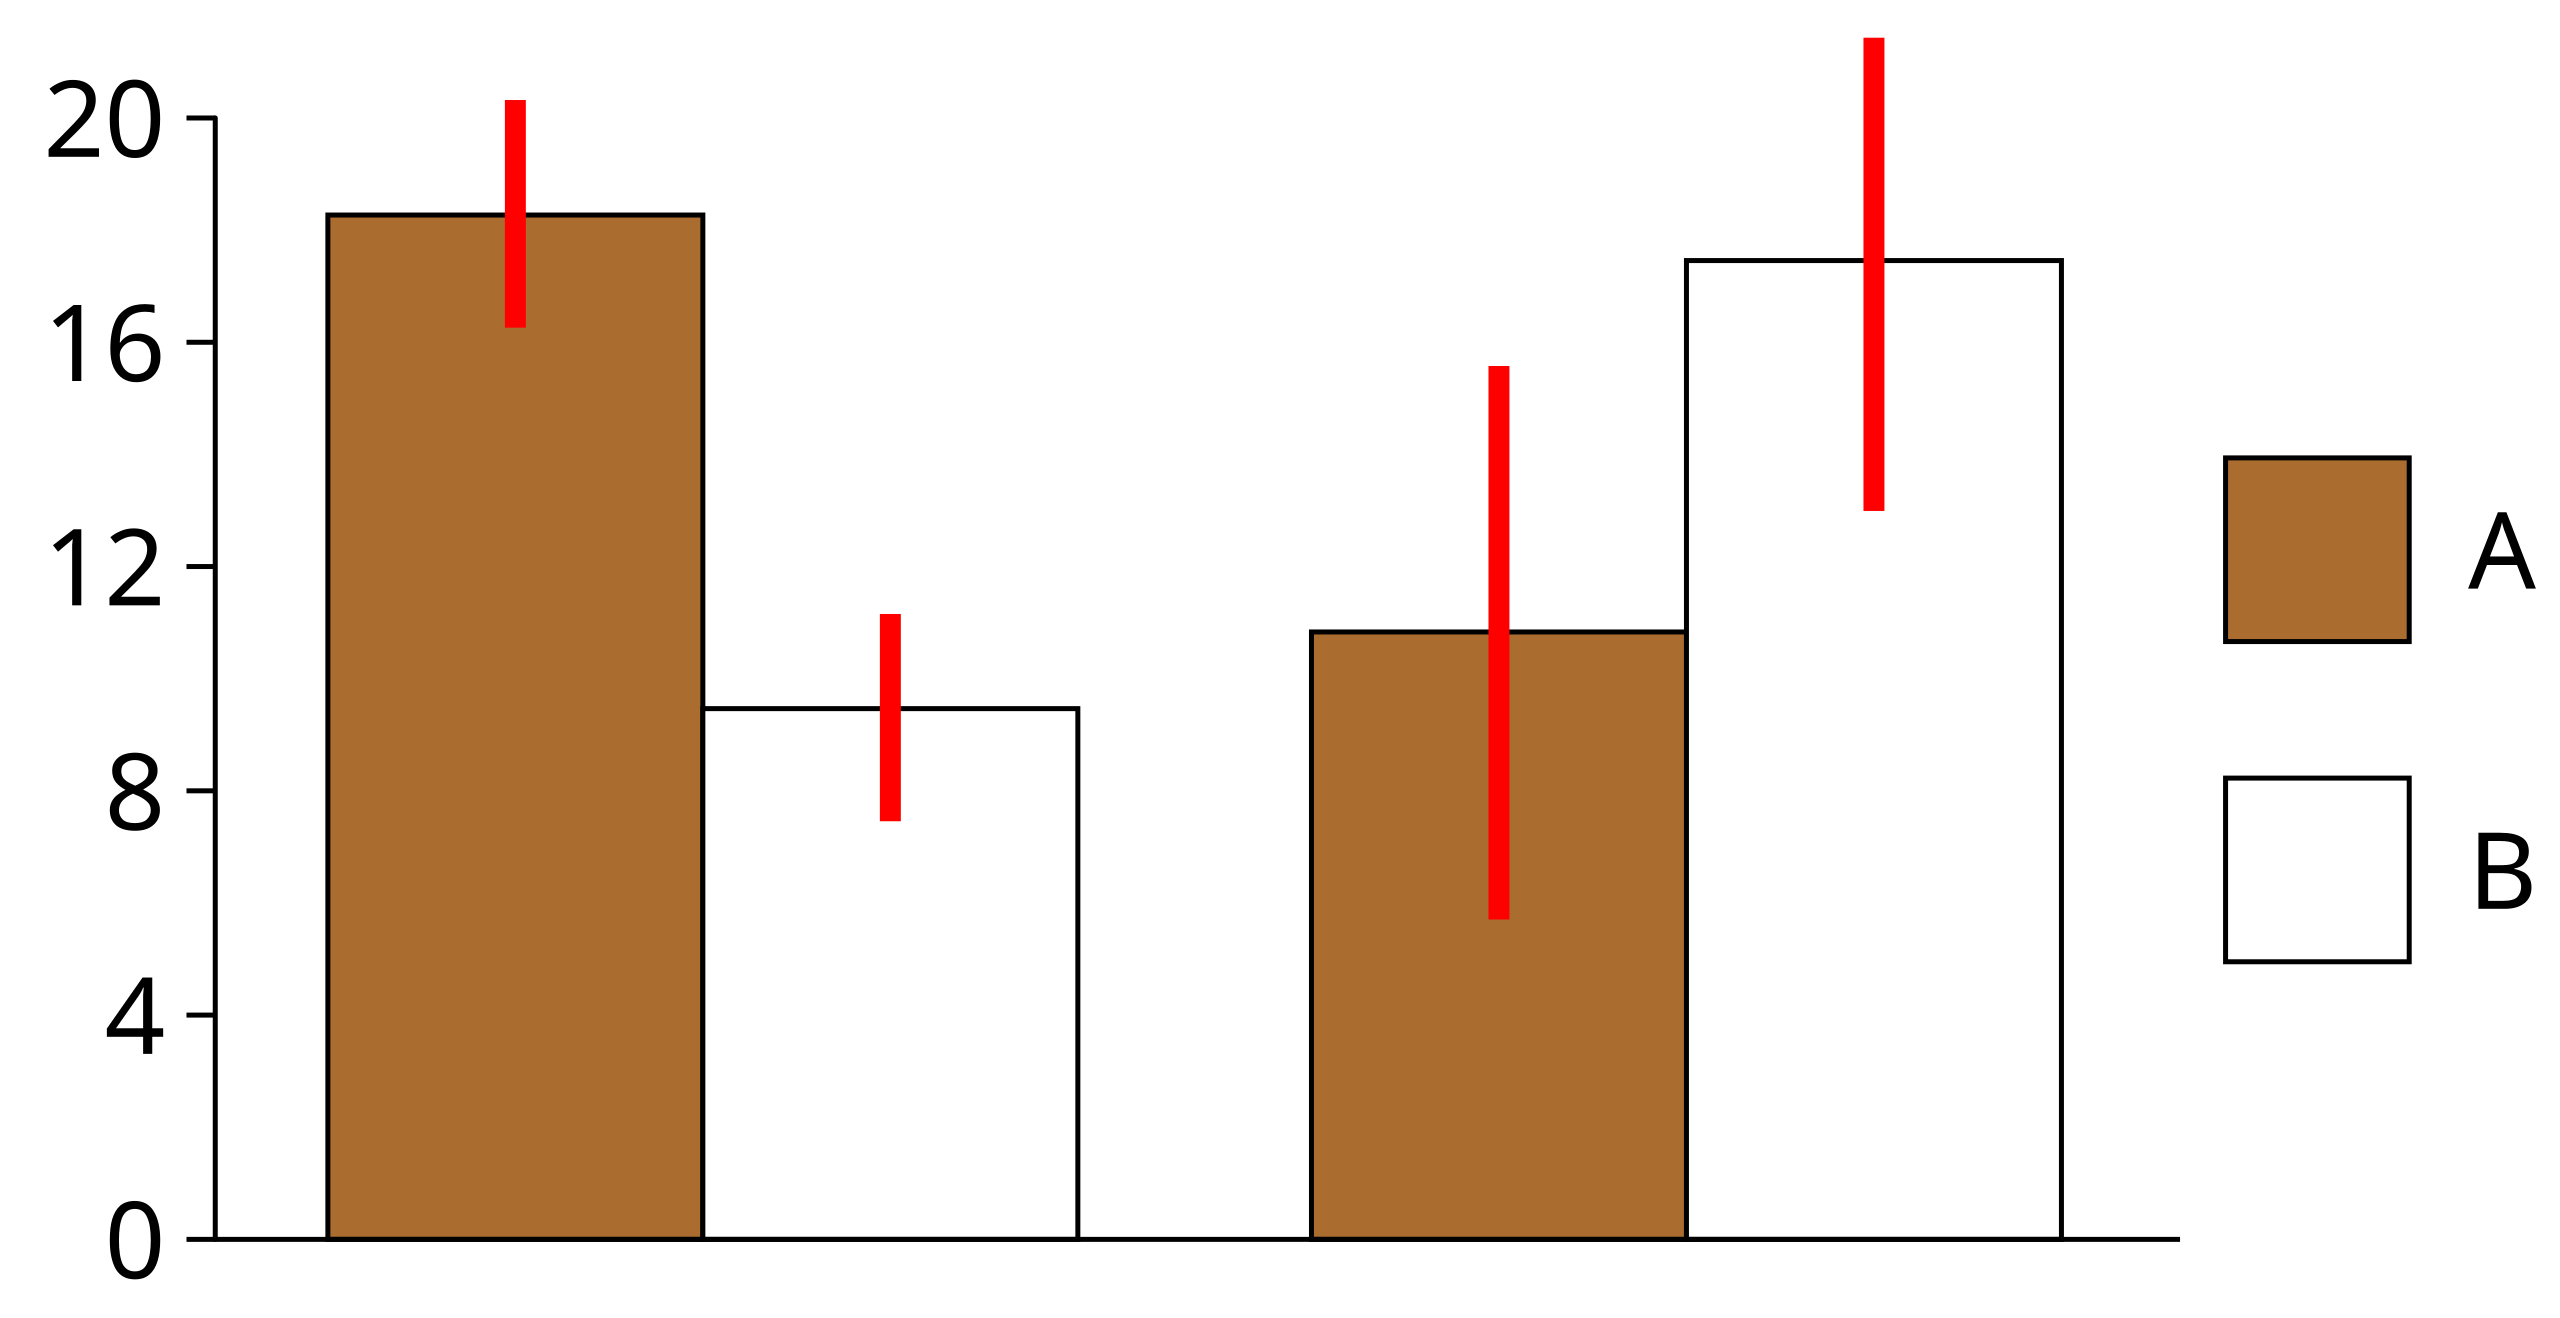
This diagram shows a confidence interval as a central estimate with lower and upper bounds on a number line. The same structure applies to a one-sample z-interval for a population proportion, where the central point is the sample proportion and the endpoints reflect the margin of error. Any labels referring to a mean can be interpreted here as representing a generic estimate for the parameter of interest. Source.
Applicability to One Categorical Variable
The one-sample z-interval is appropriate only when the data arise from a single categorical variable with two possible outcomes. This scenario corresponds directly to situations such as estimating the proportion of students who prefer online learning or the proportion of customers satisfied with a service. Because only one variable is under study, the procedure centers on the behavior of a lone proportion, not on comparisons between groups or analyses of numerical variables.
Foundations of the Interval Formula
The interval formula rests on the behavior of the sampling distribution of p-hat. When the sample size is sufficiently large and independence is satisfied, this sampling distribution becomes approximately normal. This normality is what allows the use of z-scores rather than alternative distribution shapes.
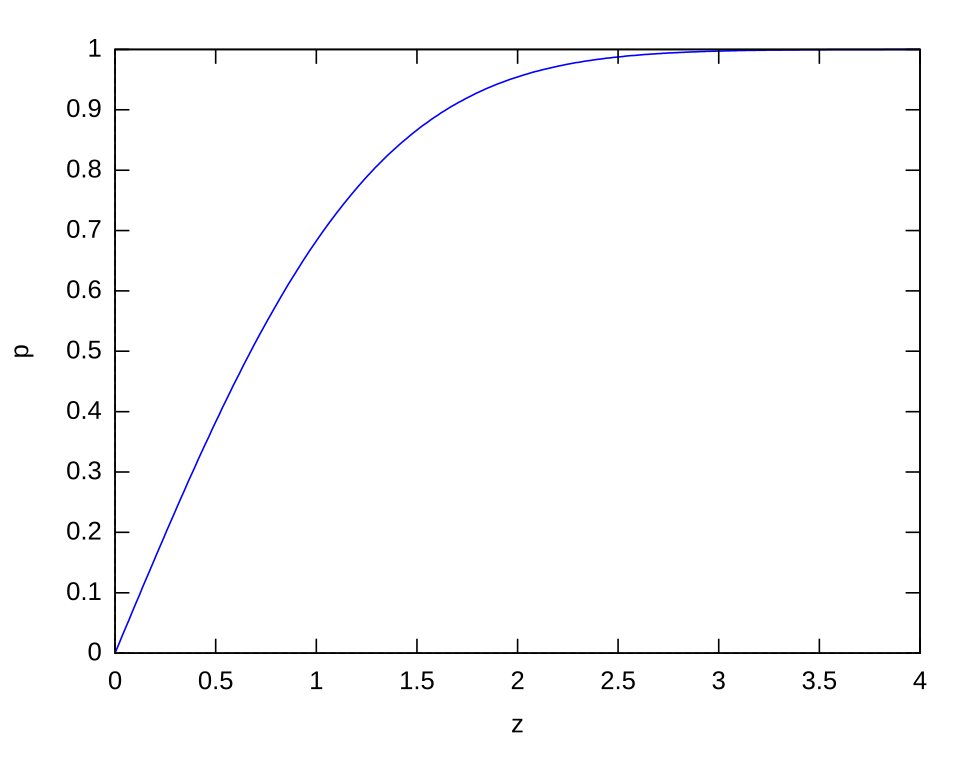
This normal curve illustrates how areas under the standard normal distribution correspond to specific z-values. Such z-values, including commonly used critical values like approximately ±1.96 for 95% confidence, form the basis of the z used in a one-sample z-interval for a population proportion. The figure includes several z-multiples beyond those required in the AP syllabus but reinforces how confidence levels arise from standard normal probabilities.* Source.
EQUATION
p-hat ± z* sqrt[(p-hat(1 − p-hat))/n]
p-hat = Sample proportion (unitless)
z* = Critical value from the standard normal distribution
n = Sample size (number of observations)
This formula represents the structure of the one-sample z-interval and highlights how the sample proportion and variability interact to form a range of plausible population values.
Ensuring Conditions Match the Procedure
Even though this subsubtopic focuses on selecting the correct interval method rather than verifying conditions in detail, it is important to note that the one-sample z-interval inherently requires independence and a sampling distribution that is approximately normal. These considerations justify choosing the z-interval over other approaches. Students must recognize that this procedure cannot be applied to small samples with extreme proportions or to data that do not arise from random methods.
Why Alternative Procedures Are Not Used
Other inference methods—such as t-intervals for means or two-sample procedures for comparing groups—are not suitable because they rely on different assumptions and target different parameters. The one-sample z-interval does not require knowledge of numerical data distributions and is not intended for estimating differences or associations. Instead, its narrow and specific purpose is estimating a single population proportion using one sample and the normal approximation framework.
Decision Framework for Selecting the Interval
When determining whether to use the one-sample z-interval for a proportion, students should check that:
The research goal is to estimate one population proportion.
The data are categorical with binary outcomes.
The information comes from one sample.
The sampling distribution can reasonably be approximated by a normal distribution.
The context aligns with estimating, rather than testing or comparing.
This reasoning ensures proper alignment between the statistical question and the chosen interval procedure, strengthening the validity and interpretability of the resulting estimate.
FAQ
A confidence interval is selected when the goal is estimation, not decision-making. The one-sample z-interval specifically estimates the plausible range of a population proportion.
A hypothesis test answers a different question: whether sample data provide evidence against a specific claimed value of the proportion.
Although both use similar ingredients (p-hat, standard error, and a z-value), the purposes and interpretations differ.
A proportion describes the relative frequency of a single category out of two possible outcomes. The mathematical framework of the z-interval relies on treating the data as a sequence of binary trials.
If a variable has more than two categories, the relative frequencies do not follow the same simple binomial structure, so a single-proportion interval is no longer appropriate.
No. The validity of the interval depends on meeting the normality and independence conditions, not on the closeness of p-hat to the true proportion.
However, very extreme p-hat values (near 0 or 1) can cause the normal approximation to fail because the distribution of the sample proportion becomes skewed.
This is why minimum counts for expected successes and failures are required.
The t-interval is designed for estimating means, where the underlying data are numerical and variation is measured through a sample standard deviation.
For proportions, the variability arises from the binomial model rather than spread around a mean. The standard error for proportions is determined entirely by p-hat and the sample size.
Because this variability is known once p-hat is observed, the normal (z) distribution is the correct reference.
Yes, large samples generally strengthen the normal approximation due to the central limit theorem. As n increases, the distribution of p-hat becomes increasingly symmetric regardless of the underlying population proportion.
Still, it is good practice to check that both expected successes and failures are reasonably large, because extremely unbalanced outcomes can still distort the distribution even in large samples.
Practice Questions
Question 1 (1–3 marks)
A researcher wants to estimate the proportion of customers who prefer a new product flavour. The data consist of one random sample in which each customer either prefers the new flavour or does not.
Explain why the one-sample z-interval for a population proportion is the correct interval procedure to use in this context.
Question 1 (1–3 marks)
• 1 mark for stating that the goal is to estimate a single population proportion.
• 1 mark for recognising that the data come from one categorical variable with two possible outcomes (e.g., yes/no).
• 1 mark for explaining that the z-interval is appropriate because it relies on the sampling distribution of the sample proportion being approximately normal under suitable conditions.
Question 2 (4–6 marks)
A school surveys a random sample of students to estimate the proportion who support extending the lunch period. Each student answers either “yes” or “no”.
(a) Identify the parameter that the school is trying to estimate.
(b) State the type of interval procedure that should be used and justify why it is appropriate.
(c) Give two conditions that should be checked before using this interval procedure and explain their relevance.
Question 2 (4–6 marks)
(a)
• 1 mark for correctly identifying the parameter as the true proportion of students who support extending the lunch period.
(b)
• 1 mark for naming the one-sample z-interval for a population proportion.
• 1 mark for justifying that it is appropriate because the aim is to estimate a single population proportion using one sample with binary responses.
(c)
• 1 mark for stating the independence condition (random sample, and sample size no more than 10% of the population if sampling without replacement).
• 1 mark for stating the normality condition (sample size large enough so that expected successes and failures are each at least about 10).
• 1 mark for explaining why these conditions matter: independence ensures valid probability reasoning, and the normality condition justifies using the z-based interval procedure.
