
AP Syllabus focus:
‘Interpret the p-value of the test, understanding it as the probability of observing a test statistic as extreme as, or more extreme than, the one calculated if the null hypothesis is true. This involves recognizing that the p-value is based on the assumption that the true population proportions are equal.’
Understanding how to interpret a p-value is essential for evaluating evidence in hypothesis testing for population proportions, guiding decisions about whether sample results meaningfully contradict a null hypothesis.
Interpreting the p-Value in Tests for Two Population Proportions
A p-value provides a standardized way to quantify how strongly the sample data contradict the null hypothesis in a two-sample z-test for population proportions. In this context, the null hypothesis asserts that the two population proportions are equal, meaning any observed difference should be attributable only to random sampling variation. Because the p-value is grounded in the assumption that the null hypothesis is true, it represents a probability calculated under a clearly defined model.
When conducting inference for two proportions, the sampling distribution of the test statistic is modeled using a standard normal distribution, allowing probabilities of observing various outcomes to be computed directly from this distribution.
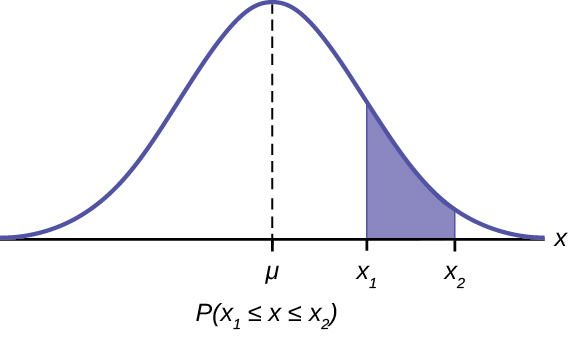
This diagram illustrates a standard normal distribution with one tail shaded to represent a probability, reinforcing that p-values are calculated as tail areas under the null distribution. Source.
Meaning of the p-Value
The p-value addresses a specific and critical question: If the null hypothesis were true, how probable is it to observe a test statistic as extreme as, or more extreme than, the one obtained from the sample? This probability is derived entirely from the theoretical null distribution and does not describe the probability that either hypothesis is true.
Term: The probability, assuming the null hypothesis is true, of obtaining a test statistic at least as extreme as the observed test statistic.
This definition emphasizes two key ideas: the assumption that the null hypothesis is true and the focus on extremeness relative to the test statistic produced by the sample.
After interpreting the definition, it is important to understand that the p-value reflects extremeness in a direction determined by the alternative hypothesis, which specifies whether the test is one-sided or two-sided.
Relationship to the Null Distribution
The null distribution represents the distribution of the test statistic under the assumption that the population proportions are equal. In the two-proportion z-test, this distribution is modeled using a standard normal curve centered at zero, reflecting the hypothesized difference between the population proportions.
For each hypothesis test, the observed z-statistic is compared to this curve. The extremeness of the observed statistic determines how much area under the curve contributes to the p-value. Because the distribution is continuous and symmetric, its properties support consistent interpretations across a range of hypothesis-testing scenarios.
How Directionality Shapes the p-Value
The alternative hypothesis determines which portion of the standard normal distribution is considered “extreme.” Each form of alternative hypothesis corresponds to a different method of calculating extremeness:
Greater-than alternative (Ha: p1 − p2 > 0)
The p-value is the probability of obtaining a z-statistic greater than or equal to the observed value.
Extreme outcomes lie in the right tail of the distribution.
These distinctions matter because a p-value measures extremeness only in the direction specified by the research question.
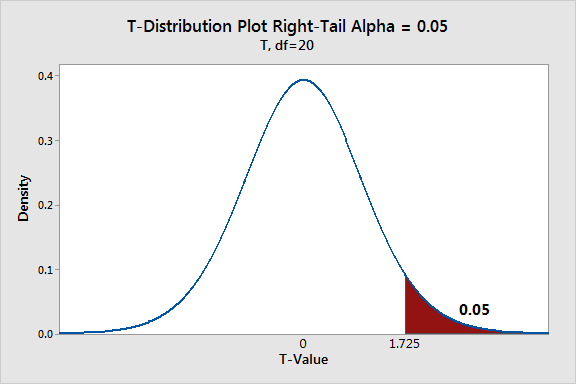
This figure shows a sampling distribution with one shaded tail, representing the region of extreme outcomes in a one-tailed hypothesis test, matching directional alternatives for p-values. Source.
Less-than alternative (Ha: p1 − p2 < 0)
The p-value is the probability of obtaining a z-statistic less than or equal to the observed value.
Extreme outcomes lie in the left tail of the distribution.
Not-equal alternative (Ha: p1 − p2 ≠ 0)
The p-value is the probability of obtaining a z-statistic whose absolute value is at least as large as the observed value.
Extreme outcomes lie in both tails, and the total p-value reflects this two-sided extremeness.
Interpreting the Strength of Evidence
A p-value does not provide a yes-or-no answer; instead, it provides a measure of how compatible the observed data are with the assumption that the population proportions are equal. Smaller p-values reflect outcomes that would rarely occur under the null hypothesis, implying stronger evidence against it.
Interpreting this evidence involves understanding several key ideas:
A small p-value indicates low compatibility between the data and the null hypothesis because such extreme differences in sample proportions would occur infrequently if the population proportions were actually equal.
A large p-value suggests high compatibility, showing that the observed difference between sample proportions is well within what could be expected due to random chance alone.
p-values are continuous measures, meaning they reflect degrees of evidence rather than binary decisions.
Key Points When Interpreting p-Values
Students should understand the following principles to accurately interpret a p-value in context:
The p-value is always computed assuming the null hypothesis is true; it does not describe the probability of the null hypothesis itself being true.
A p-value concerns test statistics, not raw data values.
Interpretation must always reference the research question, the sample, and the population proportions under study.
The extremeness measured by the p-value depends on the form of the alternative hypothesis, which determines whether the probability is one-tailed or two-tailed.
A p-value does not measure the size or practical importance of an observed difference between proportions; it only measures the strength of statistical evidence.
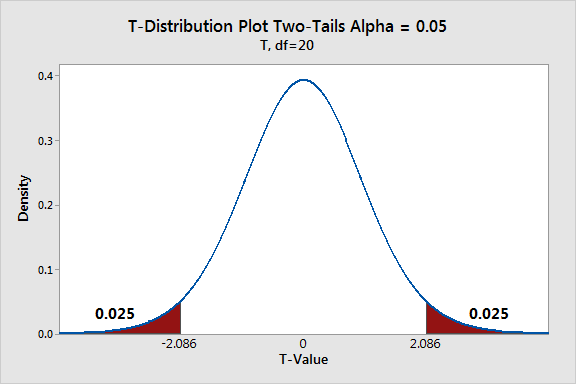
This diagram demonstrates a distribution with both tails shaded, illustrating how two-tailed tests consider extremeness in both directions when computing p-values. Source.
FAQ
Extremeness is determined by comparing the observed test statistic with the distribution expected under the null hypothesis. The further into the tail the statistic lies, the smaller the corresponding p-value.
For two-sample proportion tests, extremeness reflects how unlikely the observed difference would be if the population proportions were actually equal. The exact tail area used depends on whether the test is one-tailed or two-tailed.
The p-value is calculated entirely from the model defined by the null hypothesis. Without assuming the null is true, there is no basis for determining the expected distribution of the test statistic.
This assumption allows statisticians to establish what outcomes are typical or atypical under the condition of equal population proportions.
Not necessarily. A small p-value only indicates that the observed data are unlikely under the null hypothesis; it does not measure the magnitude of the actual difference.
Small p-values can arise from:
• A genuinely large difference in sample proportions
• A small difference combined with a large sample size
• Low variability due to high precision in the sampling distribution
Thus, practical significance must be assessed separately.
A two-tailed test measures extremeness in both directions, adding tail areas from both sides of the distribution. This increases the total probability compared with a one-tailed test that only considers one direction.
Because of this structure, the same test statistic will always produce a p-value at least as large in a two-tailed test as in a one-tailed test.
No. Swapping sample labels (for example, region A with region B) will reverse the sign of the test statistic but not its absolute value. For two-tailed tests, the p-value remains identical because it depends only on the absolute extremeness.
For one-tailed tests, the p-value will change only if the direction of the alternative hypothesis is tied to a specific group definition rather than the numerical order of the sample proportions.
Practice Questions
Question 1 (1–3 marks)
A researcher conducts a two-sided hypothesis test comparing two population proportions. The calculated test statistic is z = 2.10, and the corresponding p-value is 0.036.
Explain what the p-value of 0.036 means in the context of the test.
Question 1 (1–3 marks)
• 1 mark: States that the p-value represents the probability of observing a test statistic as or more extreme than z = 2.10, assuming the null hypothesis is true.
• 1 mark: Recognises that 0.036 indicates such an outcome is relatively unlikely under the null hypothesis.
• 1 mark: Mentions that the interpretation must be made in the context of comparing two population proportions.
Maximum: 3 marks.
Question 2 (4–6 marks)
A study compares the proportion of customers who prefer a new product in two independent regions. A two-sample z-test for the difference in proportions is carried out with the alternative hypothesis stating that the proportions differ. The resulting p-value is 0.012.
a) Interpret the p-value in the context of this study.
b) Explain what the p-value indicates about the compatibility of the sample data with the null hypothesis.
c) Discuss whether the result provides strong evidence against the null hypothesis at the 5% significance level.
Question 2 (4–6 marks)
a) Interpretation (up to 2 marks)
• 1 mark: States that the p-value is the probability of obtaining a difference in sample proportions as or more extreme than that observed, assuming the true population proportions are equal.
• 1 mark: Provides interpretation specifically referring to customer preference in the two regions.
b) Compatibility with null hypothesis (up to 2 marks)
• 1 mark: States that a small p-value indicates the data are not very compatible with the null hypothesis.
• 1 mark: Explains that the observed difference would occur only rarely by chance if the true proportions were equal.
c) Evidence against the null hypothesis (up to 2 marks)
• 1 mark: Compares the p-value (0.012) with the 5% significance level and states that it is below 0.05.
• 1 mark: Concludes that there is sufficient statistical evidence to reject the null hypothesis in favour of the alternative.
Maximum: 6 marks.
