
AP Syllabus focus:
'Make a formal decision by comparing the p-value to the predetermined significance level (α). If the p-value is less than or equal to α, reject the null hypothesis (H0: p1 - p2 = 0). If the p-value is greater than α, do not reject the null hypothesis. This step involves determining whether there is sufficient evidence to suggest a significant difference between the two population proportions.'
In this subsubtopic, you learn how to turn the numerical results of a significance test into a clear yes-or-no decision about population differences using p-values.
Making decisions in a significance test for two proportions
After computing a test statistic and its p-value for a difference of population proportions, you must decide what that result implies for the null hypothesis H0: p1 - p2 = 0. The AP syllabus emphasizes making this decision by comparing the p-value to a preselected significance level α.
The role of the significance level α
Before looking at the data, researchers choose a significance level, often α = 0.05, that sets the threshold for how unlikely the sample result must be, assuming the null hypothesis is true, in order to count as convincing evidence against H0.
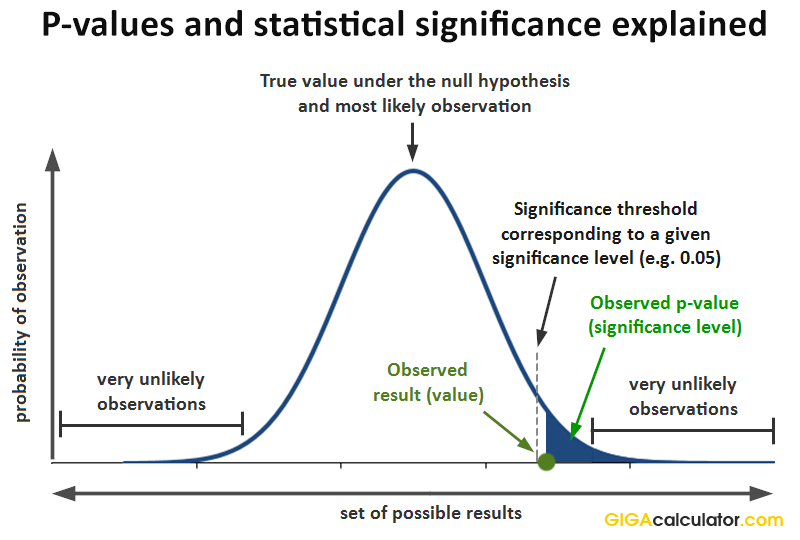
This diagram shows the relationship between the observed test statistic, the p-value tail region, and the significance threshold α. It visually reinforces how α acts as a cutoff for determining statistical significance. The numeric values in the plot are example-specific, but the conceptual structure applies to tests of population proportions. Source.
Once α is chosen, it should not be changed after seeing the p-value.
Key ideas about α:
α is chosen in advance, typically 0.10, 0.05, or 0.01, depending on how cautious the researcher wants to be.
Smaller α means stronger evidence is required to reject H0, leading to fewer rejections but more conservative decisions.
Larger α means weaker evidence is enough to reject H0, increasing the chance of rejecting H0 when it is actually true.
Understanding the p-value for decision making
The p-value summarizes how compatible the sample data are with the null hypothesis. For this subsubtopic, you do not need to compute the p-value; you only need to interpret it for decision making once it has been calculated correctly, taking into account whether the test is one-sided or two-sided.
Important features of the p-value:
A small p-value means the observed difference in sample proportions (or a more extreme one) would rarely occur if H0: p1 - p2 = 0 were true.
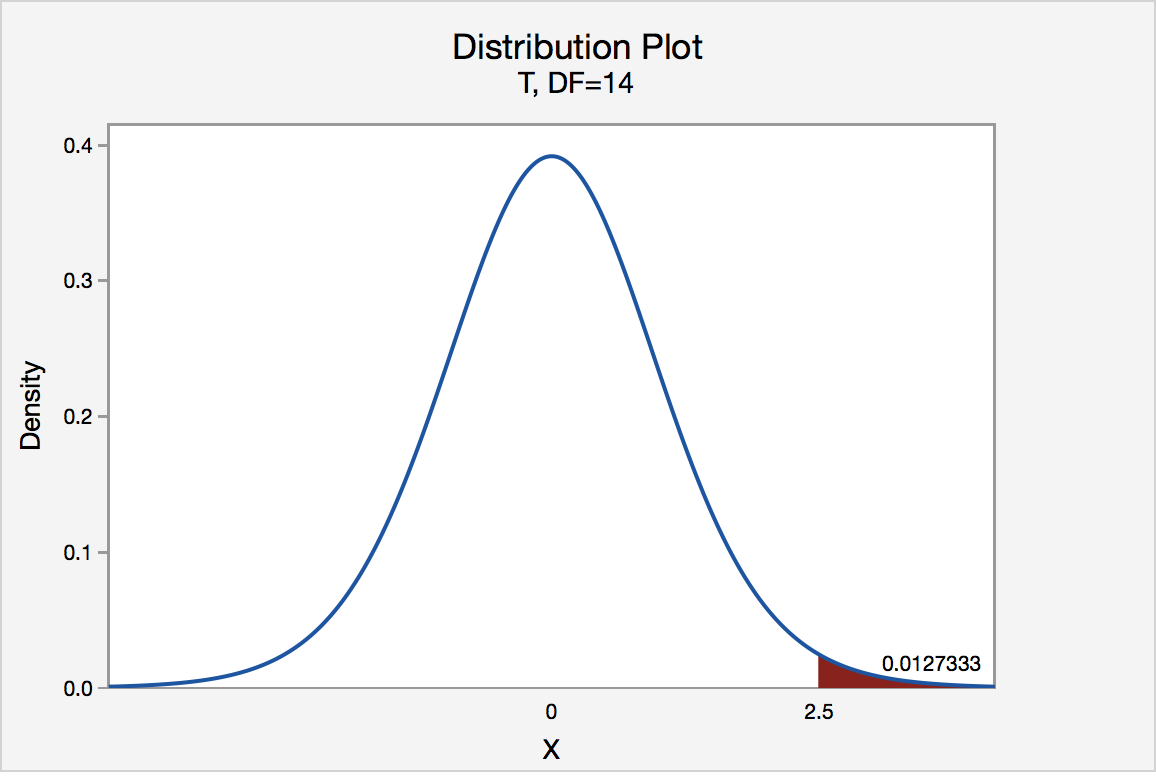
This figure displays a sampling distribution with the p-value represented as a shaded tail area. Although shown with a t-distribution, the same idea applies to the z-distribution used for two-proportion tests: the p-value measures how likely it is to see a result as extreme as the observed one if the null hypothesis is true. Source.
A large p-value means the observed difference is reasonably likely under H0 and therefore not surprising enough to count as strong evidence against H0.
The interpretation always assumes that all conditions for inference have been met and that the test statistic is valid.
The formal decision rule
The AP syllabus statement for this subsubtopic defines a clear rule:
If the p-value ≤ α, reject the null hypothesis H0: p1 - p2 = 0.
If the p-value > α, do not reject the null hypothesis.
This rule directly connects the numerical p-value to a yes-or-no decision, using the preselected α as the cutoff between “sufficient” and “insufficient” evidence against H0.
Interpreting “reject” and “do not reject”
When you apply the decision rule, the language you use is very important.
Reject H0: The data provide sufficient statistical evidence to conclude that there is a significant difference between the two population proportions in the direction described by the alternative hypothesis Ha.
Do not reject H0: The data do not provide sufficient statistical evidence for a difference in population proportions in the direction described by Ha.
Notice that “do not reject H0” is not the same as “accept H0.” Failing to reject means the evidence is not strong enough to support Ha, not that H0 has been proven true. There may still be a real difference; the sample just does not reveal it clearly at the chosen significance level.
Step-by-step decision process
Once you know the p-value and α, making a decision follows a consistent sequence:
State the null hypothesis H0: p1 - p2 = 0 and the alternative hypothesis Ha with its inequality sign (<, >, or ≠).
Identify the significance level α that was chosen before seeing the data.
Compare the p-value from the test to α.
Use the formal rule:
If p-value ≤ α, reject H0.
If p-value > α, do not reject H0.
Express the decision in context, explaining what it says about the difference between the two population proportions.
Linking decisions to evidence about population proportions
The final part of the syllabus description emphasizes that this decision step determines whether the data provide enough evidence to suggest a significant difference between the two population proportions. Your conclusion should connect the statistical decision back to the real-world question about the populations being compared, making it clear whether the evidence supports a claim of a difference or leaves that claim unconfirmed at the chosen significance level.
FAQ
Changing the significance level alters the balance between risking a Type I error and requiring stronger evidence to reject the null hypothesis. A lower significance level makes it harder to reject the null hypothesis, reducing the chance of a false positive.
A higher significance level makes rejection easier but increases the risk of concluding there is a difference in proportions when none actually exists.
The p-value assesses how surprising the observed sample difference would be if the true difference in population proportions were zero. It does not measure the magnitude of the difference, only its statistical plausibility under the null hypothesis.
Effect size can be large or small, but statistical decision-making at this step relies strictly on probability relative to the chosen threshold.
When a p-value lies near the cutoff, the decision technically follows the rule, but interpretation should be cautious.
Researchers may:
• Consider how sensitive the conclusion is to the choice of significance level.
• Report the p-value explicitly rather than emphasising a binary decision.
• Note any design limitations that could influence the precision of the estimate.
No. Statistical significance reflects evidence against the null hypothesis but does not assess the practical importance of the difference.
A very large sample can detect tiny differences that have little real-world relevance.
Practical significance should be evaluated by considering context, magnitude of the difference, and potential consequences.
Yes. A one-sided test places the entire rejection region in one direction, which reduces the p-value when the observed effect aligns with that direction.
This can make rejection of the null hypothesis more likely compared with a two-sided test, where the tail area is split across both directions.
However, choosing a one-sided test must be justified before analysing the data.
Practice Questions
Question 1 (1–3 marks)
A researcher tests whether the proportion of customers satisfied with a new service differs from 0.80. The significance level is set at 0.05. The p-value from the one-sample z-test for a proportion is 0.12.
State the formal decision about the null hypothesis and briefly justify it.
Question 1 (Total: 3 marks)
• 1 mark: States that the null hypothesis is not rejected.
• 1 mark: Identifies that the p-value (0.12) is greater than the significance level (0.05).
• 1 mark: Provides a correct justification that the evidence is insufficient to conclude the true proportion differs from 0.80.
Question 2 (4–6 marks)
A school compares the proportion of students who prefer online lessons in Year 11 with the proportion who prefer online lessons in Year 12. A two-sample z-test for the difference in proportions is conducted with significance level 0.05.
The resulting p-value is 0.004.
(a) State the decision regarding the null hypothesis.
(b) Explain, in context, what this decision implies about the two year groups.
(c) Comment on whether the result provides strong evidence about the difference between the population proportions.
Question 2 (Total: 6 marks)
(a) 2 marks
• 1 mark: States that the null hypothesis is rejected.
• 1 mark: States that the p-value (0.004) is less than the significance level (0.05).
(b) 2 marks
• 1 mark: Correctly states that there is sufficient evidence of a difference between the proportions of Year 11 and Year 12 students who prefer online lessons.
• 1 mark: Clearly explains that the difference pertains to the populations represented by the samples, not just the sample proportions.
(c) 2 marks
• 1 mark: Notes that a p-value as small as 0.004 indicates strong evidence against the null hypothesis.
• 1 mark: Explains that such a small p-value suggests the observed difference would be very unlikely if the population proportions were truly equal.
