
AP Syllabus focus:
‘A claim about the population mean can be justified by whether the confidence interval contains values that are consistent or inconsistent with the claim. The claim must be substantiated by the confidence interval and presented in the context of the research question and the data collected.’
A confidence interval offers structured evidence about a population mean, allowing researchers to evaluate whether a statistical claim is plausible by comparing claimed values to the interval’s supported range.
Understanding How Confidence Intervals Support Claims
When a confidence interval is used to assess a claim about a population mean, it provides a range of plausible values for that mean based on sample data. Claims are evaluated by determining whether the claimed value is consistent with this interval or if the data suggest that the claim is inconsistent with the plausible values implied by the sample.
A claim in statistical inference is a statement asserting something about a population parameter.
Claim: A statement proposing a specific value or relationship for a population parameter, evaluated using statistical evidence.
Confidence intervals help justify claims because they incorporate sampling variability and quantifiable uncertainty. If the claimed value does not fall within the interval, the interval indicates that the sample data are not compatible with that claim.
Interpreting Consistency and Inconsistency with a Claim
A confidence interval’s relationship to a claimed value forms the central justification:
If the claimed mean falls within the confidence interval, the data are considered consistent with the claim.
If the claimed mean falls outside the confidence interval, the data provide evidence that the claim is not supported, given the observed variability.
These evaluations hinge on understanding that a confidence interval does not guarantee the true population mean’s location but instead expresses plausible values based on the sample and chosen confidence level.
Using Context to Support or Refute Claims
Because statistical inference depends on random sampling, any justification must be connected explicitly to the research question and the data collection process. A value outside the interval suggests that if the study were repeated under similar conditions, it is unlikely the sample would yield results consistent with the claim. Therefore, justification statements must reflect both the statistical conclusion and the contextual meaning for the population studied.
The Role of Confidence Level When Justifying Claims
Confidence intervals vary in width based on their confidence level, affecting how claims are assessed:
Higher confidence levels produce wider intervals, making it more likely that a claimed value lies within the interval.
Lower confidence levels create narrower intervals, offering more precision but increasing the chance of excluding the claimed value.
Thus, the justification for accepting or rejecting a claim depends on the confidence level that guided construction of the interval. This connection underscores why students should state the confidence level clearly when interpreting an interval’s relationship to a claim.
A confidence interval also reflects the variability of sample data, which is why repeated sampling would generate intervals that sometimes capture the true mean and sometimes do not.
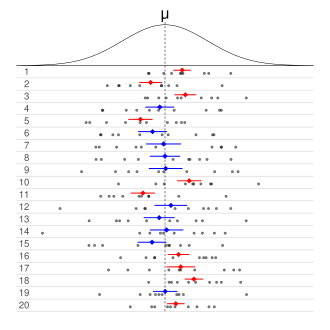
This figure shows many confidence intervals constructed from repeated random samples. Intervals that include the true mean μ differ in color from those that miss it, illustrating long-run confidence behavior and the role of sampling variability. Source.
How the Interval Structure Guides Claim Evaluation
Confidence intervals incorporate both the sample mean and the margin of error, forming the range of plausible values.
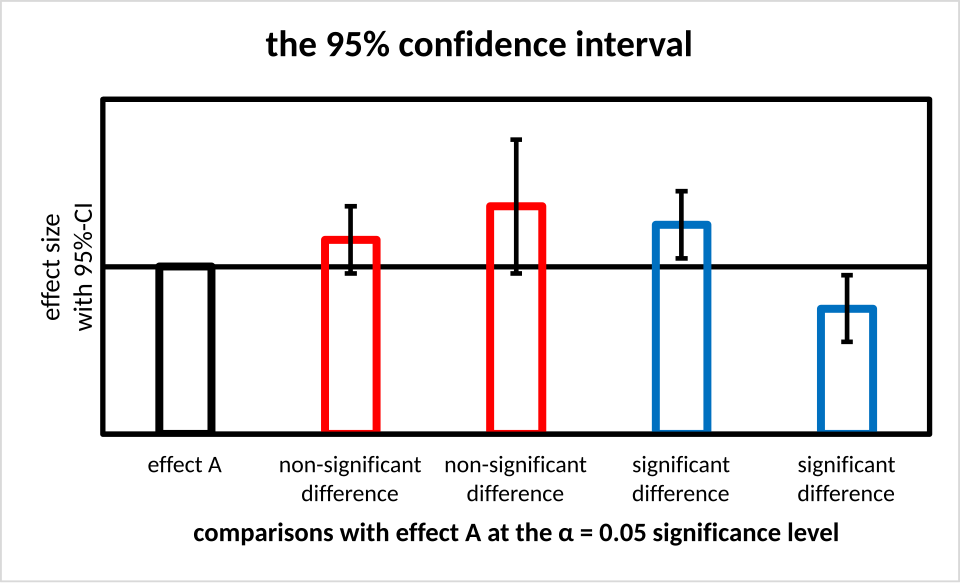
This bar chart displays sample means with 95% confidence intervals as vertical error bars. Any hypothesized mean falling outside an interval is inconsistent with that sample’s evidence. The presence of multiple groups exceeds the syllabus scope, but the interpretation of each individual interval is fully aligned with AP Statistics. Source.
EQUATION
= Sample mean
= Quantity determining the width of the interval
Although the computation itself is not the focus of this subsubtopic, understanding this structure helps explain why a claim may or may not be supported. A claim’s relationship to the interval depends on the combined influence of sample variability and chosen confidence level.
Confidence intervals do not offer proof; instead, they provide evidence. If the claim lies outside the interval, the data suggest that such a parameter value is unlikely given the sample. However, if the claim lies inside the interval, the evidence does not contradict the claim—even though it does not prove it true.
Communicating Justification Clearly
When explaining whether a claim is justified using a confidence interval, students should:
Restate the claim in context.
Specify whether the claimed value is inside or outside the interval.
Use the language of consistency rather than certainty.
Connect the conclusion explicitly to the population of interest.
Emphasize that the justification depends on sampling variability and the confidence level.
Checklist for Justifying a Claim with a Confidence Interval
Identify the claim and the population parameter involved.
State the confidence interval clearly and in context.
Compare the claim to the interval:
Inside → claim is consistent with the data.
Outside → data do not support the claim.
Discuss uncertainty, noting that the interval is one of many possible intervals that could arise from repeated sampling.
Explain the decision in the context of the statistical question and the population.
Confidence intervals thus serve as a foundational tool for evaluating claims about population means by balancing evidence, uncertainty, and contextual understanding.
FAQ
Larger samples reduce the margin of error, narrowing the confidence interval and making it easier to determine whether a claim is plausible. Smaller samples produce wider intervals, making claims harder to assess with precision.
A larger sample also stabilises the sample mean, reducing the influence of random variation and improving the strength of the justification.
A claim just outside the interval is not supported by the interval itself, but it may still be considered cautiously plausible if the margin of error is large or the confidence level is low.
However, the official statistical interpretation remains that values outside the interval are not consistent with the observed data.
Confidence intervals derive meaning only in relation to the population they estimate. Without context, the justification lacks clarity about what the interval refers to.
Stating context ensures that the interpretation connects directly to the research question, the sampling process, and the target population.
Higher confidence levels widen the interval, making more claimed values appear consistent. Lower confidence levels narrow the interval, increasing the chance a claim will fall outside.
Thus, two researchers using different confidence levels could reach different assessments of the same claim.
Yes. Because each sample contains random variation, their resulting confidence intervals may differ.
If one interval contains the claimed value and another does not, the claim may appear justified in one case but not in the other, reflecting the inherent uncertainty of sampling.
Practice Questions
Question 1 (1–3 marks)
A researcher constructs a 95% confidence interval for the mean reaction time of adults in a visual task and obtains the interval (312 ms, 348 ms). A claim is made that the true population mean reaction time is 360 ms.
Based on the confidence interval, state whether the data support this claim and briefly justify your answer.
Question 1 (1–3 marks)
• 1 mark for stating that the claim is not supported or inconsistent with the data.
• 1 mark for noting that 360 ms lies outside the interval.
• 1 mark for explaining that values outside the interval are not considered plausible for the population mean based on the sample.
Question 2 (4–6 marks)
A nutritionist investigates the average daily sugar intake of teenagers in a large city. From a random sample of 58 teenagers, a 90% confidence interval for the population mean daily sugar intake is calculated to be (67 g, 81 g).
A health organisation claims that the mean daily intake for teenagers in this city is 85 g.
(a) Using the confidence interval, determine whether this claim is consistent with the sample data.
(b) Explain why the choice of a 90% confidence level is relevant when justifying the claim.
(c) Write a contextually appropriate statement evaluating whether there is evidence to support or refute the organisation’s claim.
Question 2 (4–6 marks)
(a)
• 1 mark for stating that the claim is not supported or inconsistent with the data.
• 1 mark for recognising that 85 g is outside the interval (67 g, 81 g).
(b)
• 1 mark for explaining that a 90% confidence level indicates the interval contains plausible values for the population mean based on repeated sampling.
• 1 mark for noting that the interval width depends on the confidence level, which affects whether a claim falls within the plausible range.
(c)
• 1 mark for clearly concluding, in context, that the data provide evidence against the claim or that the claim is unlikely given the sample.
• 1 mark for referring explicitly to the population of teenagers in the city and the reasoning behind the conclusion.
