
AP Syllabus focus:
‘Recognize that a confidence interval either includes the true population mean or does not due to the variability of sample data.
- When stating "We are C% confident...", clarify that it reflects the proportion of such intervals that would contain the true mean if the study were repeated many times.
- Interpretations should always consider the context of the sample and the population from which it was drawn.’
A confidence interval provides a structured way to express uncertainty in estimating a population mean, emphasizing long-run performance and careful interpretation in real-world context.
Understanding the Meaning of a Confidence Interval
A confidence interval for a population mean is a range of plausible values for the unknown population mean based on sample data. It reflects the fact that different random samples produce different sample means, leading to variability in interval endpoints. Because of this random variation, any single interval may or may not contain the true population mean, but the method used to create the interval has a known long-run success rate.
Confidence Interval: A range of values, constructed using sample data, that is likely to contain the true population parameter at a stated confidence level.
A confidence interval must always be interpreted in the context of the situation, describing the population of interest, the measured variable, and what the interval suggests about the true mean.
Why Confidence Intervals Vary Across Samples
Confidence intervals reflect uncertainty caused by sampling variability, meaning repeated samples from the same population will differ. As the sample mean shifts due to random chance, the constructed interval shifts with it. This leads to the central idea emphasized by the syllabus: an interval either captures the true population mean or it does not.
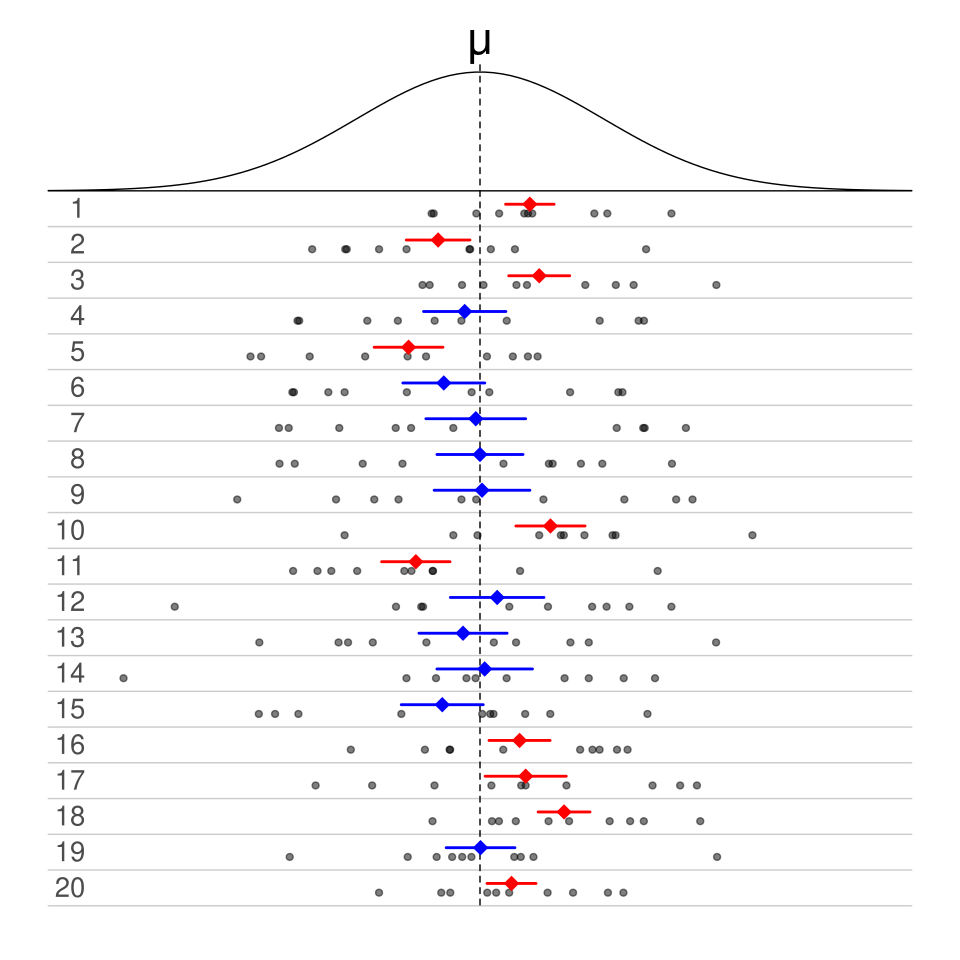
Repeated samples from a normal population with interval estimates for the mean. Blue intervals contain μ while red intervals miss it. The image emphasizes that confidence levels refer to the long-run proportion of intervals capturing the true mean. Source.
Sampling Variability: The natural variation in sample statistics that occurs when different random samples are taken from the same population.
This view reinforces why no probability statement applies to the true mean itself; instead, the probability refers to the method used to generate intervals.
Interpreting the Phrase “We Are C% Confident…”
The syllabus stresses how to correctly interpret confidence levels in everyday language. A frequent misunderstanding is thinking that there is a C% chance the true mean lies in a specific interval. Instead, the correct interpretation focuses on the reliability of the procedure, not the specific interval.
When interpreting, students should emphasize that:
The method of constructing intervals captures the true mean in C% of repeated random samples.
The particular interval constructed either does or does not contain the true mean—there is no probability associated with the completed interval itself.
Interpretation must be tied to context, always referencing the variable and population studied.
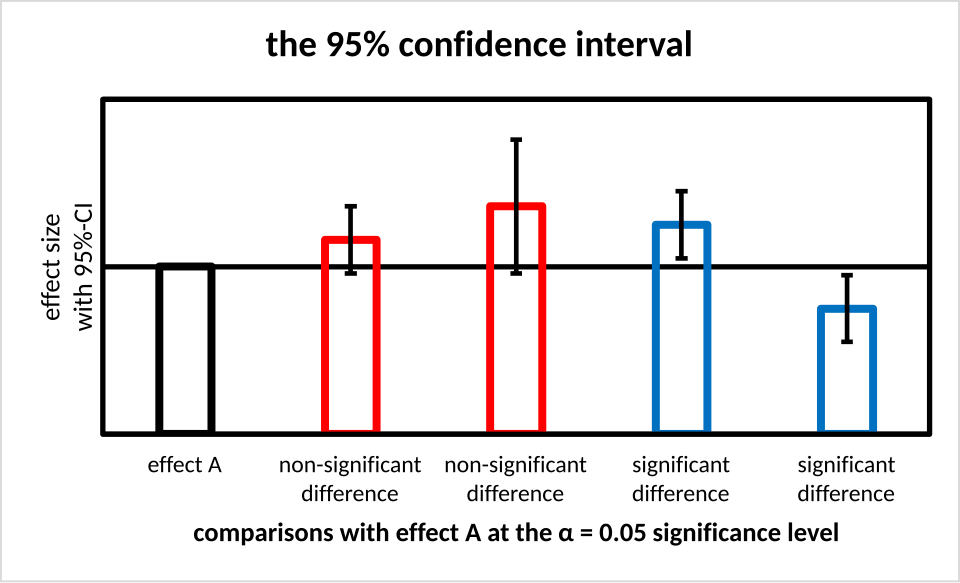
Error bars representing several 95% confidence intervals relative to a reference value. Intervals crossing the reference line are compatible with that value, while intervals entirely above or below it are not. Additional significance labels extend beyond this subtopic but visually reinforce how intervals provide plausible ranges for a mean. Source.
Contextual Interpretation in Applied Settings
A strong contextual interpretation includes three essential components. Students should be able to articulate:
The confidence level, describing long-run performance.
The population and variable being measured.
What the interval suggests about plausible values for the population mean.
For example, rather than stating a generic interpretation, a contextualized statement clarifies what aspect of the population is being estimated and why the interval provides useful information.
Relationship Between Variability and Interval Capture
The syllabus requires recognizing the fundamental dichotomy: a confidence interval either captures the true mean or fails to do so. This follows directly from random sampling and the resulting distribution of sample means. Intervals created from samples far from the true mean will not include it, while most intervals—constructed from samples closer to the population mean—will.
Confidence Level: The long-run proportion of confidence intervals, constructed using the same procedure, that will contain the true population parameter.
Students must understand that the confidence level applies to the process, not to any particular realized interval.
Common Misinterpretations to Avoid
Because confidence intervals are widely used, several misconceptions must be recognized and corrected:
Incorrect: “There is a C% chance that the true mean lies within this interval.”
Correct: “This method produces intervals that capture the true mean C% of the time.”
Incorrect: “The interval describes the variability of individual data values.”
Correct: “The interval describes uncertainty in estimating the population mean.”
Incorrect: “A narrow interval always indicates a good estimate.”
Correct: A narrow interval indicates precision but may still be based on biased or nonrepresentative data.
These distinctions are essential for valid reasoning based on intervals.
Key Components of Effective Interpretation
Students should ensure that interpretations consistently include:
The confidence level and its procedural meaning.
Clear indication that the interval provides plausible values for the population mean.
A careful link to the sampling context, including the population and variable.
Acknowledgment that the true mean is fixed and not influenced by the sample.
These elements maintain statistical integrity and align with the syllabus requirement to interpret confidence intervals within context while recognizing their long-run reliability.
FAQ
A higher confidence level increases the chance that the interval captures the true mean in repeated sampling, but it also produces a wider interval.
This wider interval can make interpretation less precise, so choosing a confidence level often involves balancing reliability and usefulness.
Common choices such as 90%, 95%, and 99% reflect different trade-offs; interpretation remains the same regardless of level: it concerns the long-run behaviour of the interval-forming method.
The true population mean is fixed, not random, so it does not move in and out of intervals.
The probability applies to the method used to generate intervals: across many repeated samples, C% of intervals will contain the true mean.
Once the interval is calculated, it either includes the true mean or it does not, so probability statements no longer apply to the finished interval.
If the sample is biased or unrepresentative, the interval may centre around a value that does not reflect the true population mean, regardless of its width or confidence level.
This means confidence intervals rely on both random sampling and correct study design. Even a perfectly calculated interval cannot fix sampling bias.
Confidence levels only describe performance under proper random sampling conditions.
Confidence intervals for means assume that either the population is roughly symmetric or the sample size is large enough for the mean to behave normally.
With strong skewness and small samples, the interval may be misleading because the sampling distribution of the mean is not well approximated by a normal model.
In such cases, analysts often increase sample size, use transformations, or choose methods that better reflect the underlying distribution.
Yes. Sampling variability can produce sample means that differ enough for their intervals not to overlap, especially when sample sizes are small or confidence levels are low.
Non-overlap does not prove that the population mean has changed; it simply reflects random variation across samples.
Over many repeated samples, most intervals will still contain the true mean, aligning with the stated confidence level.
Practice Questions
A researcher constructs a 95% confidence interval for the mean concentration of a chemical in a sample of river water. The interval is (12.4, 15.8) mg/L.
What does the 95% confidence level mean in this context?
(1–3 marks)
Interpretation of a 95% confidence level (1–3 marks):
1 mark: States that the interval gives a range of plausible values for the true mean.
1 mark: Clearly indicates that 95% refers to the long-run proportion of intervals that would contain the true population mean if the sampling process were repeated.
1 mark: Interpretation is given in context (chemical concentration in river water).
A study investigates the average time sixth-form students spend revising each day. Using a random sample of 50 students, a 90% confidence interval for the population mean revision time is calculated to be (1.7, 2.4) hours.
(a) Interpret this confidence interval in context.
(b) Explain whether the interval suggests that the true mean revision time could be 2.6 hours.
(c) A teacher claims that the average revision time is exactly 2 hours. Discuss whether the interval supports this claim.
(4–6 marks)
(a) Interpretation in context (2 marks):
1 mark: States that the interval provides a range of plausible values for the true mean revision time.
1 mark: Gives the interpretation specifically in terms of sixth-form students’ average daily revision time.
(b) Assessment of whether 2.6 hours is plausible (1–2 marks):
1 mark: States that 2.6 hours is not plausible because it lies outside the confidence interval.
1 mark: Correct explanation that intervals include plausible values for the mean and exclude values not supported by the data.
(c) Evaluation of claim that the mean is 2 hours (1–2 marks):
1 mark: Recognises that 2 hours lies within the interval and is therefore consistent with the data.
1 mark: Provides a clear explanation that the interval does not prove the mean is 2 hours but indicates that this value is plausible given the sample evidence.
