
AP Syllabus focus:
‘Null hypothesis (H0): States that there is no difference, with the population mean equal to a hypothesized value μ0 (H0: μ = μ0).
- Alternative hypothesis (Ha): States there is a difference, formulated based on the research question. It can be one-sided (Ha: μ < μ0 or Ha: μ > μ0) or two-sided (Ha: μ ≠ μ0).
- For matched pairs, clearly define the order of subtraction when calculating the mean difference.’
This subsubtopic introduces how to construct statistical hypotheses when testing a population mean, emphasizing clarity, directionality, and contextual consistency with the research question guiding the test.
Understanding the Purpose of Hypotheses in Mean Testing
Formulating hypotheses provides a structured framework for evaluating evidence about a population mean.
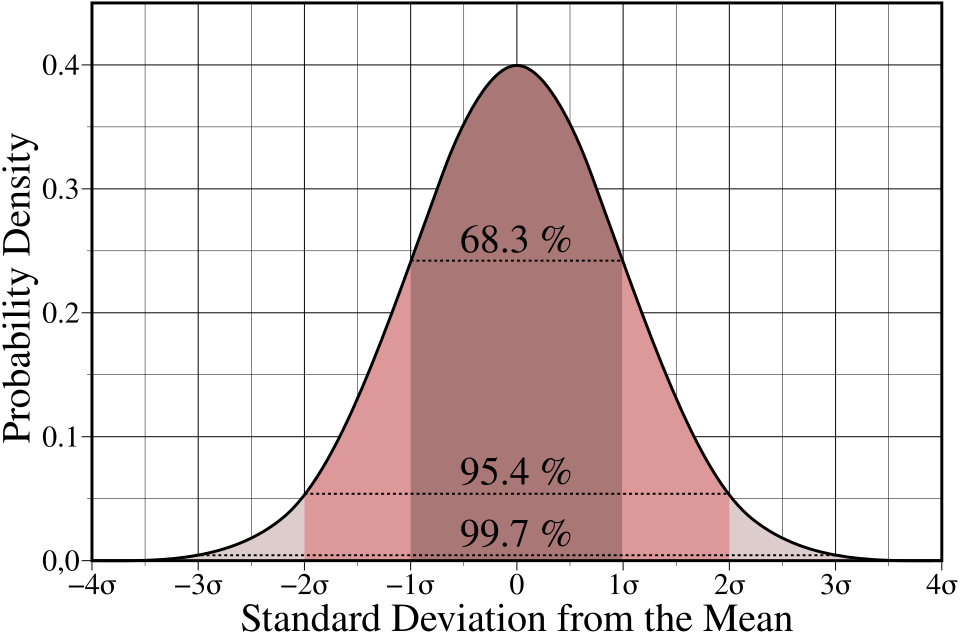
A standard normal curve showing shaded tail areas where unusually extreme values occur when evaluating a hypothesis under the null model. The figure includes additional detail on standard deviations and tail regions that will be explored later in inference topics. Source.
In AP Statistics, the goal is to translate a contextual research question into mathematically precise statements that can be tested using sample data. These statements guide the entire significance-testing process and ensure that conclusions align with the study’s aims.
The Null Hypothesis (H0)
The null hypothesis is the foundational claim against which evidence is evaluated. In tests concerning a population mean, it asserts that there is no difference between the true mean and a specified benchmark value.
Null Hypothesis (H0): A statement proposing that the population mean equals a hypothesized value, typically written as .
The null hypothesis reflects the status quo or a position of no effect. It always includes equality ( = ) because statistical tests assume this value to compute probabilities under the sampling distribution. For matched pairs situations, the null hypothesis concerns the mean difference between paired observations.
After stating a null hypothesis, it is essential to evaluate whether the context provides a meaningful value for μ₀, such as a standard, historical value, target, or baseline expectation.
The Alternative Hypothesis (Ha)
The alternative hypothesis represents the claim for which researchers seek supporting statistical evidence. It expresses the suspected direction or presence of a difference in the population mean.
Alternative Hypothesis (Ha): A statement describing how the population mean may differ from the hypothesized value, expressed as one-sided (\mu < \mu_0 or \mu > \mu_0) or two-sided ().
A one-sided alternative is appropriate when the research question suggests a directional expectation, such as determining whether a mean is greater than or less than a target.
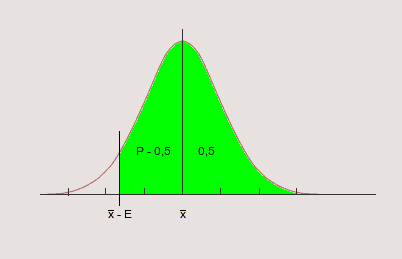
A normal distribution with a single removed tail, illustrating a one-tailed context where only one direction of extreme values is considered evidence against the null hypothesis. Source.
A two-sided alternative is used when any difference from μ0 is of interest, without specifying direction.
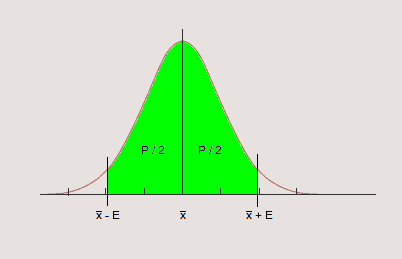
A normal curve with both tails removed, representing a two-tailed situation in which unusually high or low values may contradict the null hypothesis. Source.
The alternative hypothesis guides how extreme values are evaluated during significance testing and determines whether the test examines one or both tails of the sampling distribution.
Choosing Between One-Sided and Two-Sided Alternatives
Selecting the form of Ha must occur before viewing sample data, ensuring that the hypothesis reflects the scientific question rather than results. Key considerations include:
Whether the research question is explicitly directional.
Whether deviations in both directions carry practical significance.
Ethical and methodological expectations that prevent adjusting hypotheses post-analysis.
A clear, context-grounded alternative hypothesis enables accurate interpretation of the test results.
Hypotheses in Matched Pairs Settings
When data come from matched pairs, the focus shifts from individual measurements to the differences within pairs. The hypotheses must therefore be written in terms of the mean difference, often denoted as μ_d.
Mean Difference (μ_d): The population mean of the differences computed as (first measurement – second measurement) across all pairs.
Because the direction of subtraction determines the sign of differences, it is critical to clearly define the order of subtraction before stating hypotheses. Changing the subtraction order reverses the meaning of the hypotheses and the interpretation of the sample results.
Matched pairs hypotheses typically take the form:
H_a: \mu_d < 0, H_a: \mu_d > 0, or
After defining subtraction order, researchers can meaningfully interpret whether positive or negative differences support the alternative claim.
Structure and Clarity in Hypothesis Statements
Effective hypothesis formulation requires precision and contextual grounding. Hypotheses must:
Refer explicitly to population parameters, not sample statistics.
Use symbols such as μ or μ_d rather than x̄.
Match the research question’s focus and direction.
Avoid vague or informal language such as “the mean changes” without specifying how.
Well-formulated hypotheses shape every subsequent step of the significance test, clarifying which outcomes provide evidence against the null hypothesis.
Checklist for Formulating Hypotheses
Students can ensure correctness by applying the following structured approach:
Identify the parameter: Determine whether the test concerns a population mean (μ) or a mean difference (μ_d).
Determine μ₀: Establish the hypothesized benchmark value.
State H0 explicitly using equality.
Choose the appropriate Ha form based on the research question’s wording and intent.
Confirm consistency with context to ensure that the hypotheses meaningfully represent the real-world scenario.
Developing skill in hypothesis formulation strengthens statistical reasoning, enables coherent test interpretation, and ensures fidelity to the inferential framework used in AP Statistics.
FAQ
The hypothesised mean should come directly from context: a claimed value, an industry standard, a historical benchmark, or a target set by researchers.
It must be a value that stakeholders consider meaningful. Without contextual justification, choosing a hypothesised mean can undermine the interpretation of the test.
Statistical tests require a specific value to compute probabilities under the assumption that the null hypothesis is true.
The equality statement provides a precise reference distribution. Without it, the test statistic cannot be evaluated because the model lacks a fixed parameter value.
Choosing the wrong direction can prevent a study from detecting the effect it aims to measure.
For example:
• If the true mean is higher but Ha states it is lower, the test will never reject H0 in the correct direction.
• Directional errors can invalidate conclusions, even with strong data.
When the context does not clearly predict whether the mean is higher or lower, a two-sided hypothesis is generally preferred.
This reduces the risk of overlooking meaningful effects in either direction. Researchers may later refine directionality in future studies, but not within the same test.
The sign of each paired difference depends on which measurement is subtracted from the other.
If the order is not defined:
• The meaning of positive or negative differences becomes unclear.
• Hypotheses such as mean difference greater than zero lose interpretive value.
• The direction of the alternative hypothesis may reverse, leading to incorrect conclusions.
Practice Questions
Question 1 (1–3 marks)
A nutritionist claims that the mean sugar content of a certain brand of cereal is 12 grams per serving. A student believes the true mean is different from 12 grams.
(a) State the null hypothesis for this test.
(b) State the appropriate alternative hypothesis.
Question 1
(a) 1 mark: Correct null hypothesis stated as H0: mean = 12 grams.
(b) 1 mark: Correct two-sided alternative hypothesis stated as Ha: mean ≠ 12 grams.
(If answers include clear notation or correctly worded statements without symbols, full marks may still be awarded.)
Total: 2 marks.
Question 2 (4–6 marks)
A researcher is investigating whether a new study technique improves students’ mean test scores. A previous cohort using the traditional method had a mean score of 75. The researcher collects a random sample of students using the new technique and wishes to test whether the new method leads to higher mean scores.
(a) Define the parameter of interest.
(b) Formulate the null and alternative hypotheses.
(c) Briefly explain why a one-sided alternative is more appropriate than a two-sided alternative in this context.
Question 2
(a) 1 mark: Parameter defined as the population mean test score for students using the new study technique.
(b) 2 marks:
• 1 mark for correct null hypothesis: H0: mean = 75.
• 1 mark for correct alternative hypothesis: Ha: mean > 75.
(c) 2 marks: Explanation recognising that the research question specifically asks whether the new method improves scores, which implies a directional expectation; therefore only higher means contradict the null. Responses must reference direction explicitly.
Total: 5 marks.
