
AP Syllabus focus:
‘The one-sample t-test is the appropriate method for testing a population mean when the population standard deviation σ is unknown. For matched pairs, differences between pairs are computed first; then, the t-test is conducted on these differences as if they were a single sample.’
This subsubtopic explains how to choose the correct testing method for a population mean when the population standard deviation is unknown, emphasizing when and why the one-sample t-test is appropriate.
Understanding the Appropriate Testing Method
Selecting the correct inference procedure requires recognizing when data conditions point toward a t-test rather than a z-test. In AP Statistics, the one-sample t-test becomes essential whenever the population standard deviation, σ, is unknown—a realistic scenario in nearly all practical data settings. Because real-world studies typically rely on sample statistics, students must understand why the t-distribution framework underlies inference for means.
When σ Is Unknown: Why the One-Sample t-Test Is Required
The one-sample t-test addresses uncertainty introduced by estimating the population standard deviation with the sample standard deviation s. This substitution affects the sampling distribution of the test statistic, making it more variable than the standard normal model. As a result, the test statistic follows a t-distribution with n − 1 degrees of freedom, rather than a standard normal distribution.
t-Distribution: A family of symmetric, bell-shaped distributions used when the population standard deviation is unknown and the sample size is finite.
Because the t-distribution places more area in the tails than the normal distribution, it appropriately reflects the added variability from estimating σ.
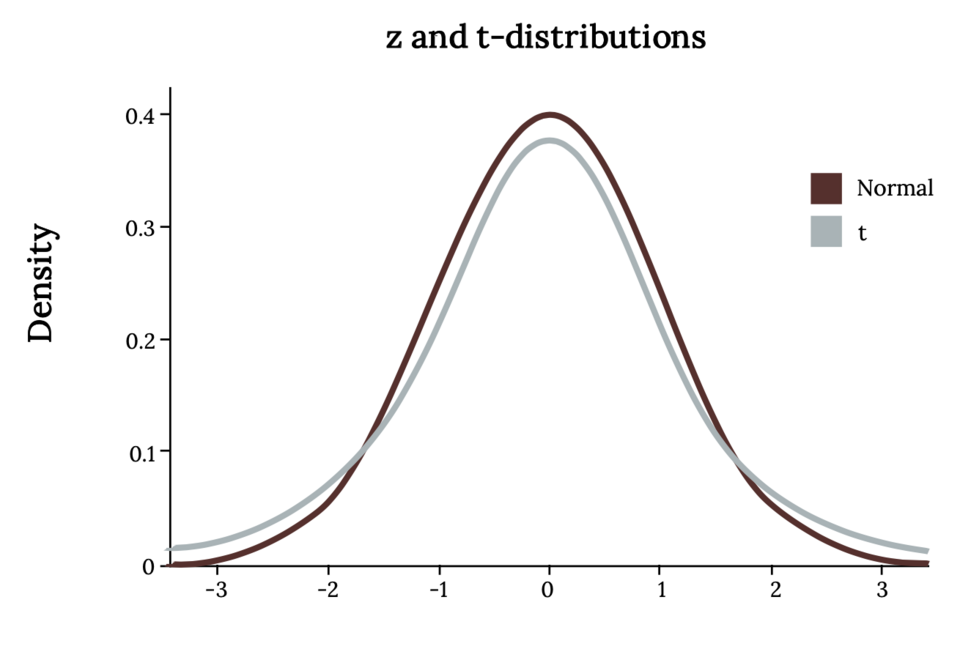
This figure compares the standard normal curve with a Student’s t-distribution, highlighting the heavier tails of the t-model. The increased tail area represents additional uncertainty introduced when σ is unknown and estimated by s, which justifies using the t-distribution for the one-sample t-test. The visual reinforces how variability affects inference for population means. Source.
As sample size increases, the t-distribution approaches the normal distribution, reinforcing how larger samples reduce uncertainty.
A t-test is therefore the correct method whenever inference about a population mean relies on sample data with unknown σ and reasonably normal sampling behavior.
Structure of the One-Sample t-Test
A one-sample t-test examines whether a sample provides convincing evidence that the population mean differs from a specified value. The method uses the sample mean, sample standard deviation, and sample size to compute the test statistic, which measures how far the observed sample result departs from what the null hypothesis predicts.
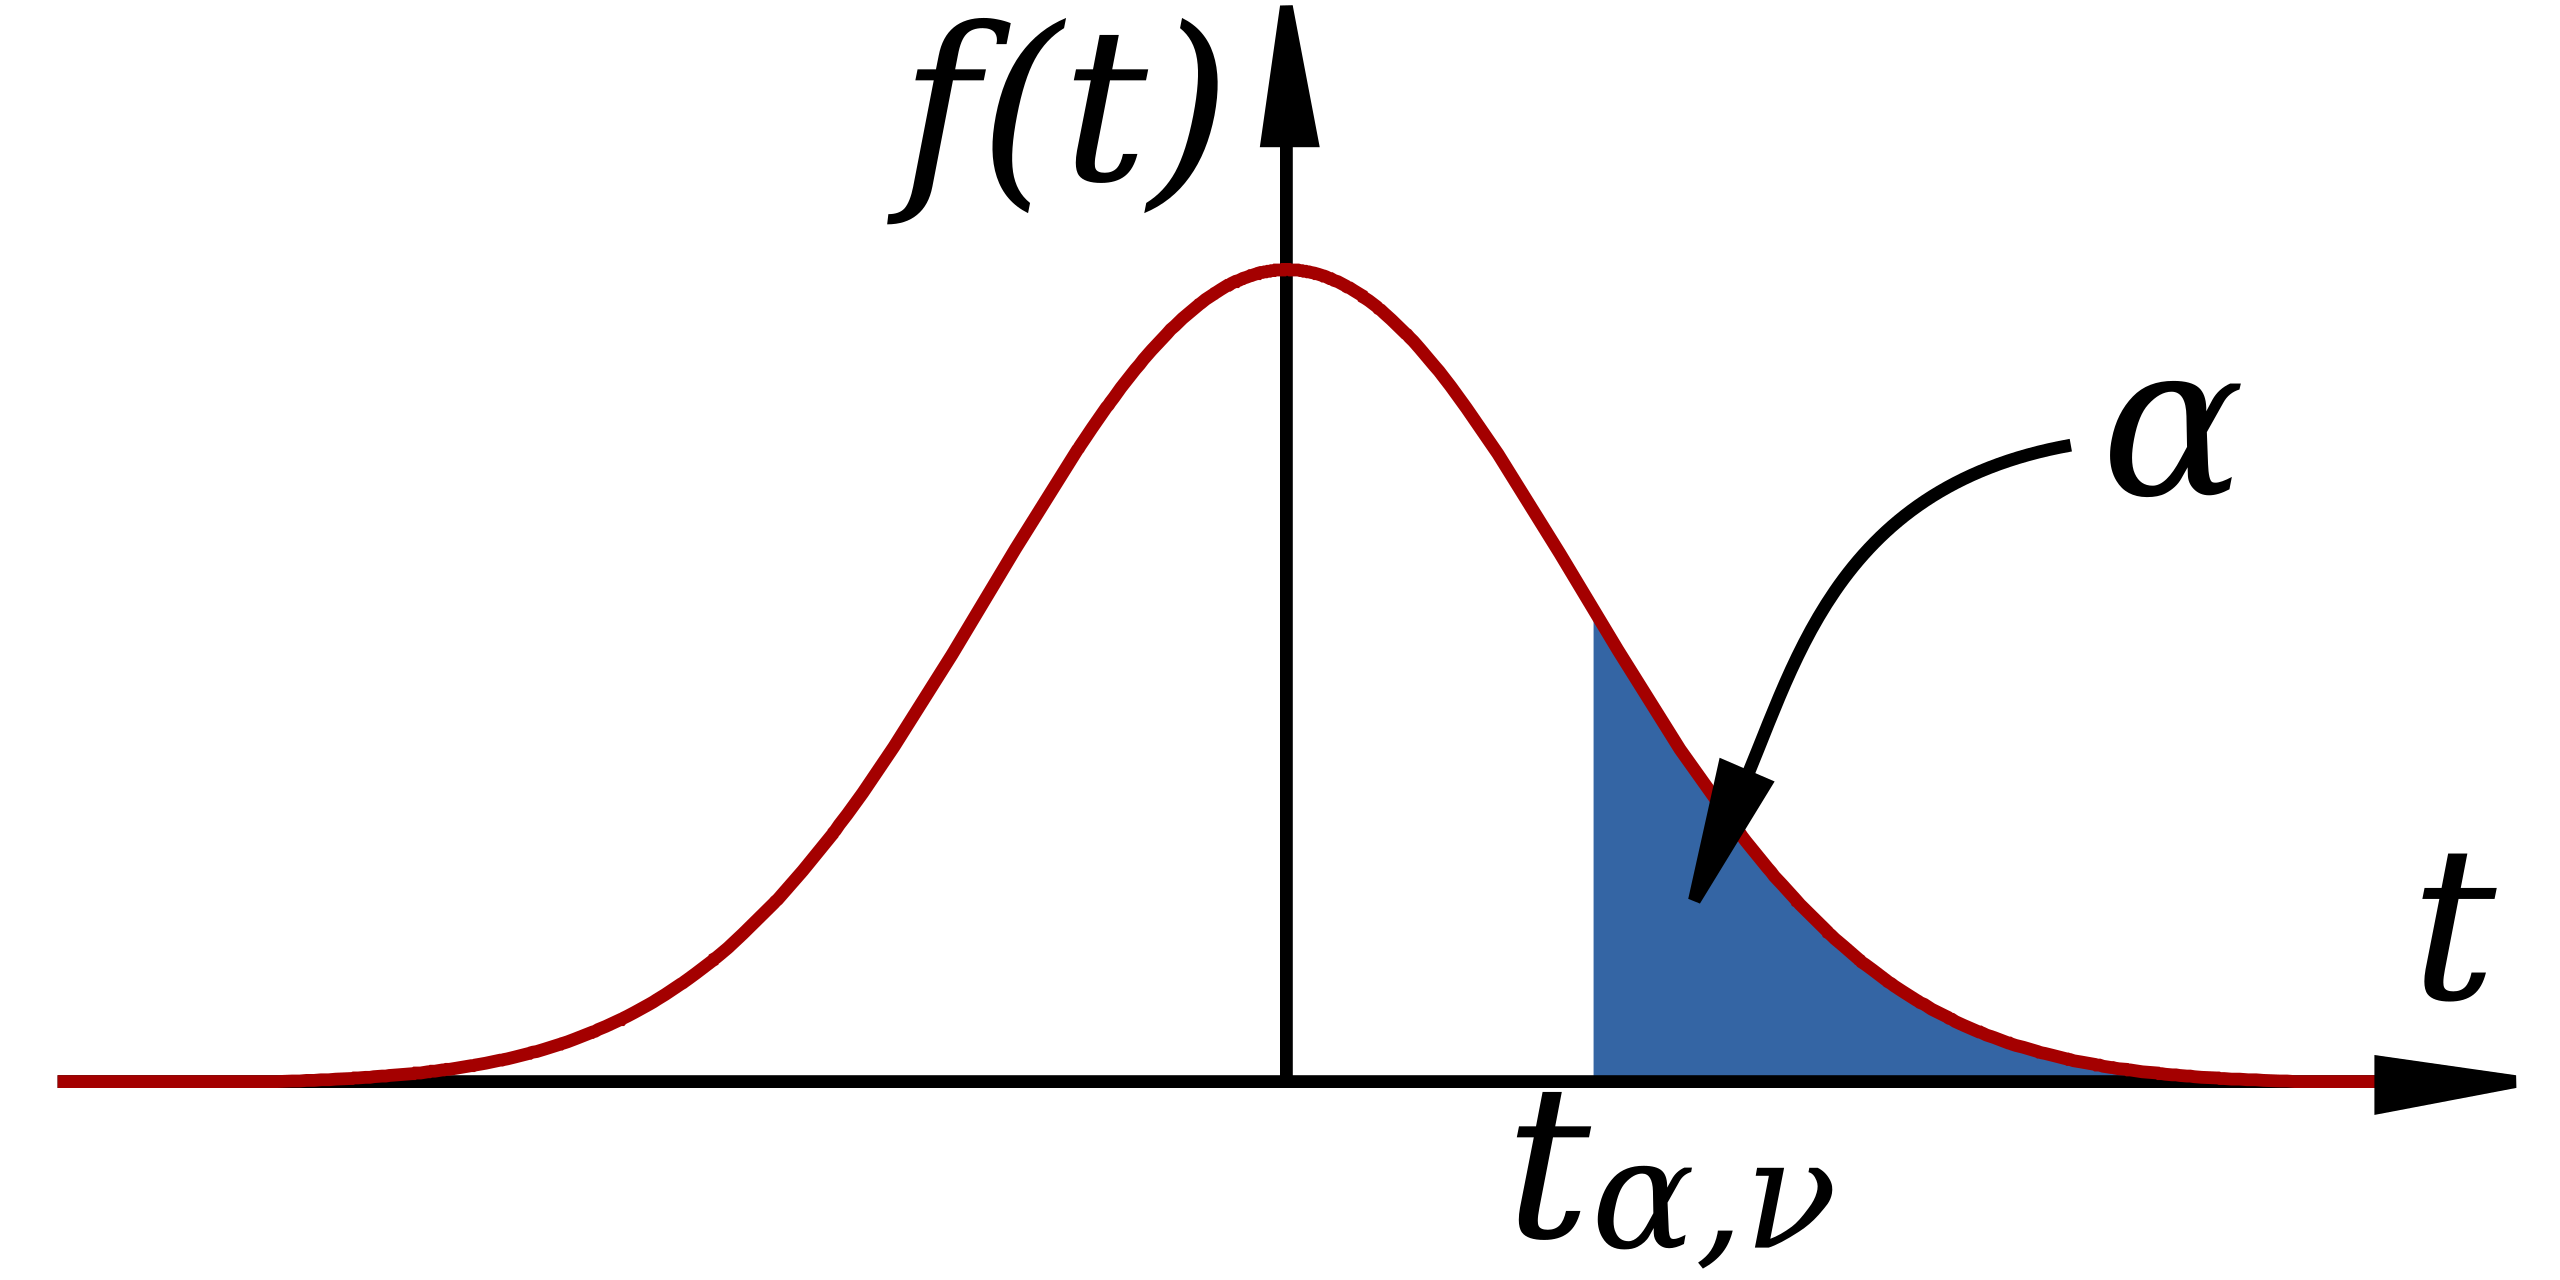
This diagram displays a Student’s t-distribution with a marked critical value tp,νt_{p,\nu}tp,ν and a shaded tail region. It illustrates how a computed t-statistic is compared against a reference distribution to determine whether sample evidence is unusually extreme under the null hypothesis. The shaded tail, representing probability p, anticipates concepts of significance levels and p-values used in formal hypothesis testing. Source.
EQUATION
= Sample mean
= Hypothesized population mean
= Sample standard deviation
= Sample size
This formula quantifies the discrepancy between the sample mean and the hypothesized mean in standardized units of estimated standard error. The resulting statistic is compared to the t-distribution with n − 1 degrees of freedom to determine the strength of evidence against the null hypothesis.
Applying the One-Sample t-Test to Matched Pairs
Matched pairs designs require a modified version of the one-sample t-test. Instead of analyzing raw measurements separately, the procedure focuses on the differences within each pair, reducing extraneous variation and isolating the effect of interest. By treating these differences as a single sample, the t-test evaluates whether the mean difference in the population is zero or some other value defined by the research context.
Matched Pairs Data: A dataset in which two related observations form a pair, such as before-and-after measurements or observations matched by characteristics.
Once differences are computed, the one-sample t-test proceeds identically to the standard case. The approach ensures that inference reflects the paired structure of the data and the dependence between observations.
Identifying When the One-Sample t-Test Is Appropriate
Students should be able to distinguish scenarios that call for a t-test from those requiring different inference tools. The following points summarize when the one-sample t-test is the correct choice:
Conditions Indicating the t-Test Is Appropriate
Unknown σ: Population standard deviation is unavailable and must be estimated using s.
Single quantitative variable: The goal is to assess the mean of one group or the mean difference in a paired setting.
Approximately normal sampling distribution: Data come from a sample large enough for the Central Limit Theorem to apply or show no strong skewness or outliers for smaller samples.
Comparison to a hypothesized mean: The research question concerns whether a population mean equals or differs from a specific value.
Why Not Use a z-Test?
A z-test requires knowing the population standard deviation, a condition rarely satisfied in practice. Using a z-test when σ is unknown underestimates variability and inflates Type I error risk, making the method inappropriate for most real data applications.
Process Outline for Conducting the One-Sample t-Test
Although full calculations belong to later subtopics, this section provides a conceptual overview of the testing method’s steps:
State the hypotheses about the population mean.
Check conditions for independence and approximate normality.
Compute the t-statistic using sample data.
Determine the p-value from the t-distribution with n − 1 degrees of freedom.
Make a decision about the null hypothesis based on the significance level.
Phrase the conclusion in context, linking statistical findings to the real-world question.
These notes emphasize when and why the one-sample t-test is the appropriate inference method for a population mean, providing a foundation for later subsubtopics on hypothesis formulation, test execution, and interpretation.
FAQ
Estimating the population standard deviation introduces extra uncertainty because the sample standard deviation varies across different samples. This added variability means the distribution of the test statistic has heavier tails than the normal distribution.
As sample size increases, the estimation becomes more stable, and the t-distribution gradually approaches the normal distribution.
Fewer degrees of freedom create a wider, flatter t-distribution, reflecting greater uncertainty in estimating variability.
As degrees of freedom increase, the distribution becomes narrower, providing more precise inference. This means small-sample tests are more conservative, requiring stronger evidence to reject the null hypothesis.
Situations include:
• When data are strongly skewed or contain outliers in small samples.
• When the variable is categorical rather than quantitative.
• When observations are dependent without representing matched pairs.
• When the research question concerns something other than a population mean.
In such cases, alternative methods or data transformations may be required.
Look for scenarios where each observation in one group has a natural partner in the other. This may involve before-and-after measurements, twins, or participants matched on characteristics such as age or gender.
Matched pairs tests reduce unexplained variability by focusing on the within-pair differences, leading to more sensitive inference when pairing is meaningful.
Treating paired data as if it came from independent samples inflates variability because it fails to account for the correlation between paired measurements.
This leads to:
• Loss of statistical power
• Increased risk of failing to detect meaningful effects
• Misleading estimates of variability
Using a matched pairs t-test ensures correct handling of dependence and produces more accurate conclusions.
Practice Questions
A researcher wants to test whether the mean resting heart rate of adults in a town differs from 70 beats per minute. The population standard deviation is unknown.
Explain which testing method is appropriate for this situation and why.
(1–3 marks)
Question 1 (1–3 marks)
• 1 mark: States that the one-sample t-test is the appropriate method.
• 1 mark: Recognises that the population standard deviation is unknown, requiring use of the t-distribution.
• 1 mark: Explains that the t-test is suitable for testing a claim about a single population mean using sample data.
A nutritionist collects data on the amount of time (in minutes) that clients take to complete a standard meal-preparation task before and after a training workshop. For each client, the nutritionist records the paired times and wishes to determine whether the workshop reduces the average preparation time.
(a) Identify the appropriate testing method for this study and justify your choice.
(b) State the form of the hypotheses for the test.
(c) Explain why the normality condition must be considered before carrying out this test.
(4–6 marks)
Question 2 (4–6 marks)
(a) Appropriate method (1–2 marks)
• 1 mark: Identifies the matched pairs t-test (one-sample t-test on differences).
• 1 mark: Justifies that differences within each pair must be analysed because the data consist of paired before-and-after measurements.
(b) Hypotheses (1–2 marks)
• 1 mark: States the null hypothesis: mean difference = 0 (no change).
• 1 mark: States the alternative hypothesis: mean difference < 0 (workshop reduces preparation time).
(c) Normality condition (1–2 marks)
• 1 mark: Explains that the distribution of the differences must be approximately normal, especially for small samples.
• 1 mark: States that this ensures the t-test provides valid results because the sampling distribution of the mean difference must be approximately normal.
