
AP Syllabus focus:
‘Independence: Data must be a random sample or from a randomized experiment, and if sampling without replacement, the sample size should be no more than 10% of the population.
- Normality: If the sample size is less than 30, check that the data is free from strong skewness and outliers; if skewed, use a larger sample size to rely on the Central Limit Theorem.’
Before conducting a one-sample or paired t-test, students must verify core assumptions ensuring that the procedure produces valid inferences from sample data. This page outlines those requirements.
Verifying Conditions for t-Tests
Understanding the Purpose of Conditions
Conditions for a t-test help ensure that the sampling distribution of the test statistic behaves as expected under the model. Violating these assumptions increases the risk of misleading results, such as inaccurate p-values or incorrect conclusions. AP Statistics emphasizes verifying independence and normality of the sample data because these criteria directly support the validity of the inferential process.
Independence Condition
The independence condition requires that observations in the sample do not influence one another. Independence is essential because the t-test assumes that each data value provides unique information about the population.
Independence: A condition stating that individual observations in a sample are not related or dependent on each other, ensuring unbiased estimates and valid inference.
Independence is primarily justified through study design rather than numerical checks. For the t-test, two main requirements apply:
Random sampling or random assignment must be present to guard against systematic bias.
When sampling without replacement, the sample size must satisfy the 10% condition, where
The sample size is no more than 10% of the population, ensuring that removing sampled individuals does not meaningfully alter the population.
These requirements support the assumption that each observation represents one draw from a stable population distribution.
Normality Condition
The normality condition addresses the shape of the population distribution. Because the t-test relies on modeled normality of the sample mean, strong skewness or outliers can distort results.
Normality Condition: A guideline requiring the sample data to come from a population that is approximately normal or a sample large enough for the Central Limit Theorem to apply.
Students assess normality through visual or descriptive characteristics of the data, not through formal hypothesis tests.
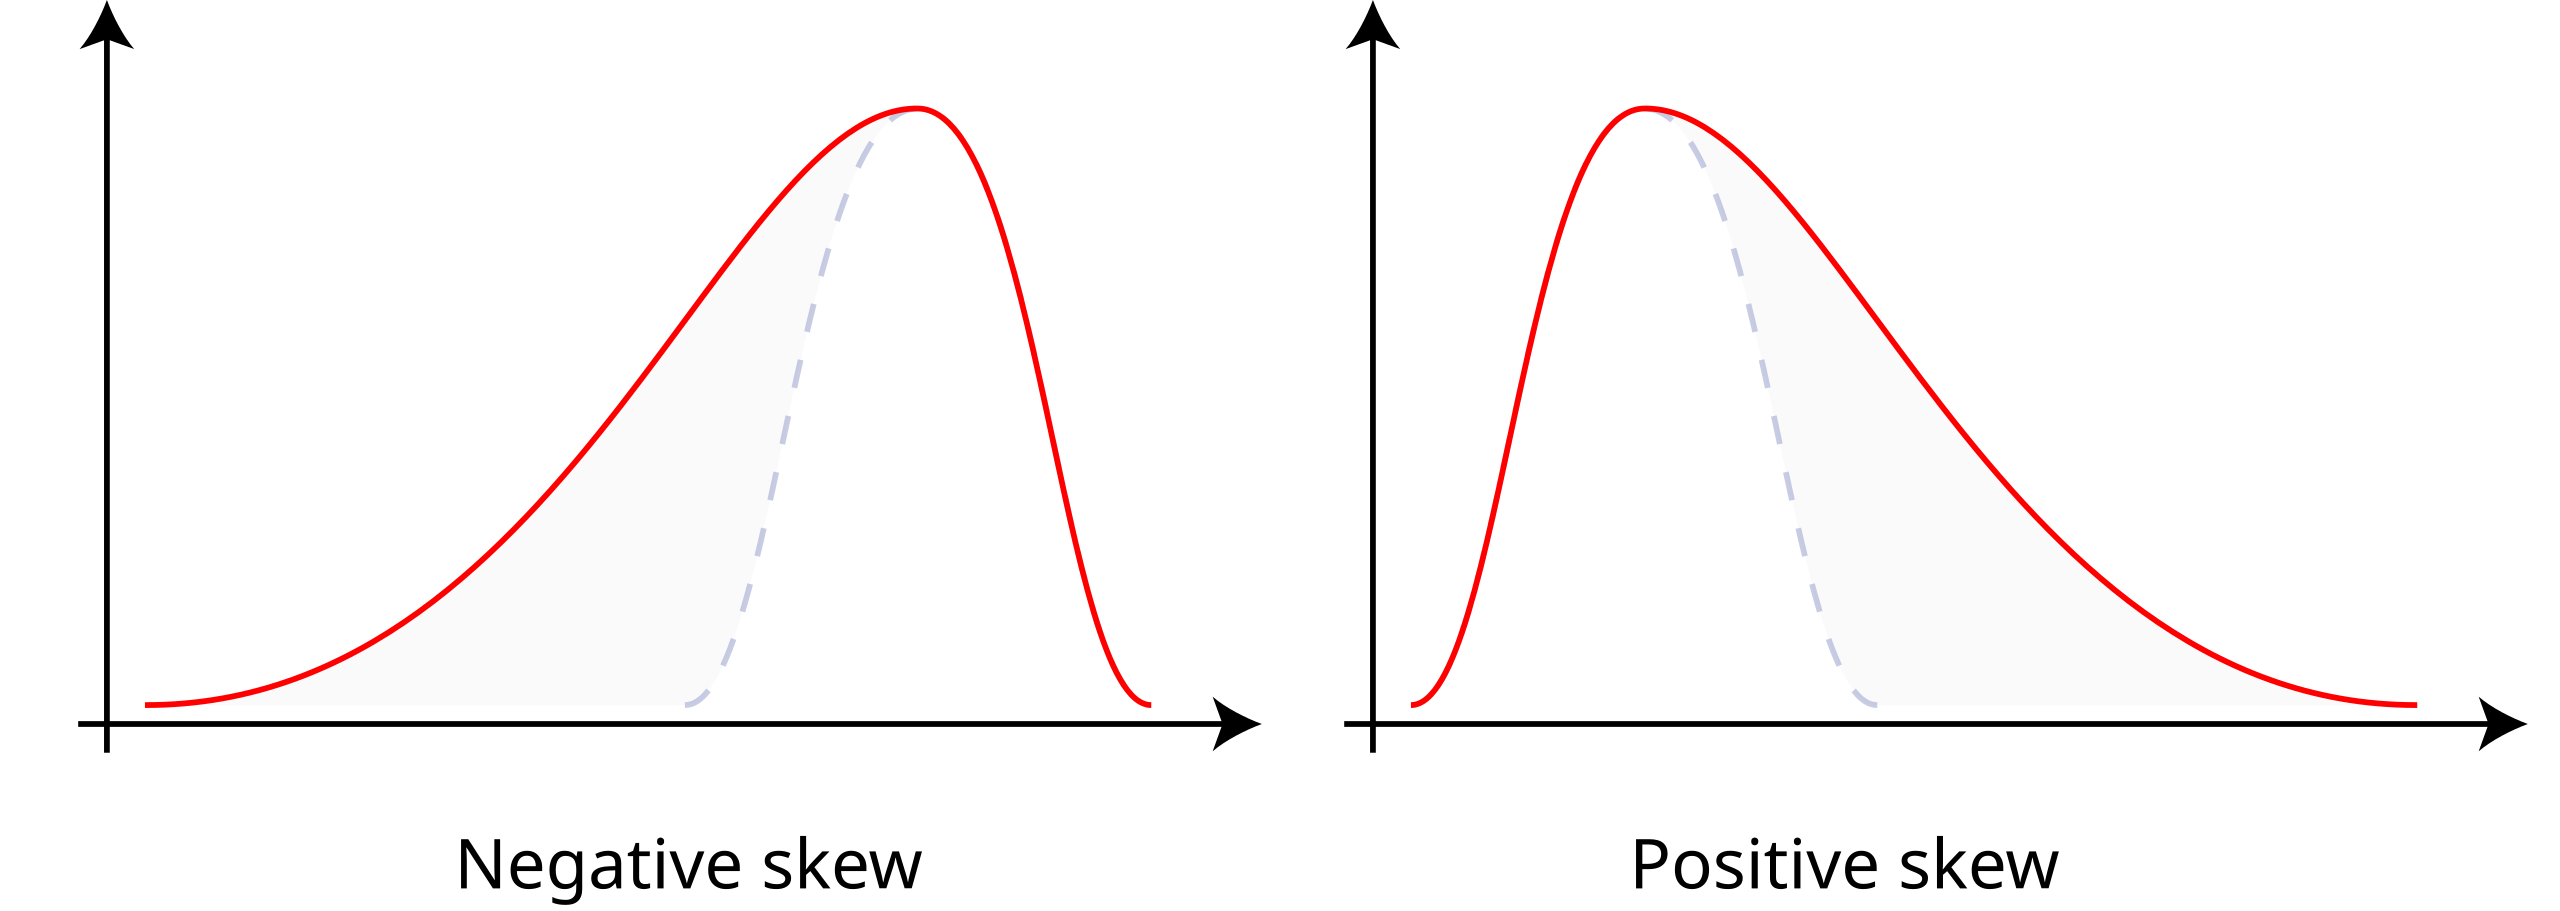
This diagram compares symmetric, positively skewed, and negatively skewed distributions, helping students visually evaluate skewness when checking normality for a t-test. Source.
The AP Statistics specification emphasizes the following:
If sample size < 30, the distribution should not show strong skewness or outliers.
If the sample is skewed, a larger sample size is needed so the Central Limit Theorem can make the sampling distribution of the sample mean approximately normal.
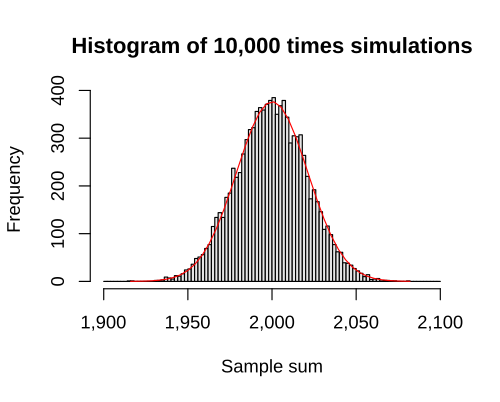
This histogram with an overlaid normal curve illustrates how, with larger sample sizes, the sampling distribution approaches normality as predicted by the Central Limit Theorem. Source.
For moderate to large samples (typically n ≥ 30), the t-test is robust to deviations from normality.
Why Independence Matters in a t-Test
Independence ensures that the sample mean’s variability is accurately captured by the standard error. If observations influence each other, the variability of the sampling distribution no longer matches what the t-model assumes. Even with perfect normality, lack of independence invalidates the t-test because the computed test statistic would no longer reflect true random variation.
Why Normality Matters in a t-Test
The t-test statistic compares the observed sample mean to a hypothesized mean using a model based on the t-distribution. That model is appropriate only when the underlying sampling distribution of the sample mean is roughly normal. The more skewed or irregular the data, the less likely the t-distribution accurately describes the test statistic. Consequently, p-values may become unreliable. Ensuring normality—either through the shape of the sample or through sufficient sample size—protects the method from distortion.
Relationship Between Sample Size and Normality
Sample size plays a central role in determining whether the t-test assumptions hold:
Small samples require data that appear roughly symmetric and free of extreme values.
Larger samples benefit from the Central Limit Theorem, which states that as sample size increases, the sampling distribution of the sample mean becomes increasingly normal, even when the population distribution is not.
This relationship helps justify t-tests in applied settings, where perfect normality in real-world data is uncommon.
Steps for Checking Conditions Before a t-Test
Before calculating the test statistic, students should proceed systematically:
Confirm random sampling or random assignment based on the study description.
Verify the 10% condition when sampling without replacement.
Assess normality using graphs or descriptive features of the sample distribution.
Confirm sample size adequacy when skewness is present.
Proceed with the t-test only if both independence and normality conditions are reasonably satisfied.
These steps ensure the integrity of the inferential process.
Supporting the Validity of Inference
When the independence and normality conditions are met, the t-distribution provides a reliable model for evaluating the test statistic. This allows students to interpret the p-value confidently and make conclusions grounded in sound statistical reasoning. Failure to check these assumptions risks drawing conclusions unsupported by the data, a central concern addressed throughout AP Statistics.
EQUATION
= Sample mean
= Hypothesized population mean
= Sample standard deviation
= Sample size
Although this formula defines the t-statistic, it is valid only when the independence and normality conditions described above are adequately met.
FAQ
Mild skewness is generally acceptable, but strong skewness is indicated by a long tail, clear asymmetry, or clusters far from the centre of the distribution.
Look for:
• A tail that extends noticeably farther on one side
• Gaps or clear separation between most data and tail values
• Several points unusually distant from the main cluster
If any of these features dominate the plot, the normality condition may not be satisfied for small samples.
Yes. For matched pairs, the conditions apply to the distribution of the differences, not the original raw measurements.
You must check:
• Independence of the differences, supported by random sampling or random assignment
• Normality of the distribution of differences, especially when the number of pairs is below 30
Strong skewness or outliers in the differences, even if not present in the original data, can invalidate the t-test.
Often yes, because the t-test is reasonably robust, but reliability depends on the severity of the skewness.
A sample of 25–29 with only mild or moderate skew typically produces a sampling distribution close enough to normal for the t-test to work well.
If the skewness is more pronounced, consider:
• Using a larger sample
• Transforming the data (if contextually appropriate)
• Using a non-parametric method (though not part of the AP course)
Clusters can indicate that the data may come from multiple underlying subpopulations, which can compromise the assumption that the sampling distribution of the mean is approximately normal.
Clusters matter when:
• They create visible bumps or multiple peaks in the distribution
• They distort symmetry enough that the sample mean no longer reflects a single underlying population structure
For sample sizes below 30, noticeable clustering is a red flag for the normality condition.
Yes. Random sampling reduces but does not eliminate all threats to independence.
Independence can still fail if:
• Individuals influence each other (e.g., measurements taken in social groups)
• The sampling method inadvertently links observations (e.g., consecutive measurements on the same subject)
• Environmental or temporal effects cause dependence between observations
Random sampling supports independence, but context must still be considered carefully.
Practice Questions
Question 1 (1–3 marks)
A researcher collects a random sample of 18 observations from a population and plans to conduct a one-sample t-test for the population mean. The dotplot of the sample shows no strong skewness and no outliers.
(a) State whether the normality condition for a t-test is satisfied and justify your answer.
(b) Explain why verifying independence is necessary before proceeding with the t-test.
Question 1
(a) 1 mark
• Award 1 mark for stating that the normality condition is satisfied because the sample size is under 30 but the distribution shows no strong skewness or outliers.
(b) 1–2 marks
• 1 mark for stating that independence must be verified to ensure observations do not influence one another.
• 1 mark for referencing random sampling or similar design-based justification.
Total: 2–3 marks
Question 2 (4–6 marks)
A wildlife biologist measures the average wing length of birds in a protected habitat. She selects 25 birds using simple random sampling without replacement from a population of approximately 600 birds. The distribution of wing lengths in the sample is moderately skewed to the right, with no extreme outliers. She wishes to carry out a one-sample t-test for the mean wing length.
(a) Assess whether the independence condition is met.
(b) Assess whether the normality condition is met for this sample.
(c) Determine whether it is appropriate to proceed with the t-test, giving statistical justification.
Question 2
(a) 1–2 marks
• 1 mark for identifying that simple random sampling supports independence.
• 1 mark for stating that the sample size (25) is less than 10% of the population (600), so the 10% condition is satisfied.
(b) 1–2 marks
• 1 mark for noting the sample size is below 30.
• 1 mark for correctly stating that moderate skew without outliers is usually acceptable, but with n = 25 there may be some concern; however, the absence of strong skewness or outliers supports approximate normality.
(c) 2 marks
• 1 mark for concluding it is appropriate to proceed with the t-test.
• 1 mark for giving valid justification that both independence and approximate normality conditions are reasonably met.
Total: 4–6 marks
