
AP Syllabus focus:
‘Use the outcome of the significance test to support or refute a claim regarding the difference between two population means. A rejected null hypothesis supports a claim of difference, while a non-rejected null hypothesis suggests maintaining the current state of belief (no difference) about the population means. The justification should relate directly to the context of the research question and the evidence provided by the test results.’
Justifying claims from significance test results requires interpreting statistical evidence, evaluating whether conclusions align with sample findings, and clearly connecting decisions back to the research context.
Understanding the Role of Significance Tests in Claim Justification
A significance test assesses whether observed differences between two sample means provide convincing evidence for a population-level difference. The decision emerging from such a test is central to determining whether a claim is supported or not. Because inference is rooted in probability, claims must always be justified with careful reference to both the null hypothesis and the strength of evidence provided by the data.
When discussing justification, it is crucial to frame statements in relation to the competing hypotheses. The null hypothesis represents the assumption of no difference between the population means, whereas the alternative hypothesis reflects the claim being evaluated.
Null Hypothesis (H₀): A statement asserting no difference in population means, serving as the baseline assumption tested against observed data.
This evaluative structure ensures that decisions rely on statistical reasoning rather than subjective preference or expectation.
Using the p-Value to Support or Refute Claims
The p-value is the primary measure used to determine whether the data provide strong enough evidence to challenge the null hypothesis. A low p-value indicates that the observed difference between sample means would be unlikely if the null hypothesis were true, strengthening support for the alternative claim.
p-Value: The probability of observing a test statistic as extreme as, or more extreme than, the actual sample result, assuming the null hypothesis is true.
Because the p-value guides the reject-or-fail-to-reject decision, it also informs whether a claim is statistically justified. Statistical justification must reference how the p-value compares to the preselected significance level (α), the threshold defining what counts as sufficiently unlikely under H₀.
After interpreting these values, students must articulate a reasoning chain that links numerical evidence with the research claim. Clear justification requires explicitly describing how the test outcome supports or contradicts the proposed statement about population means.
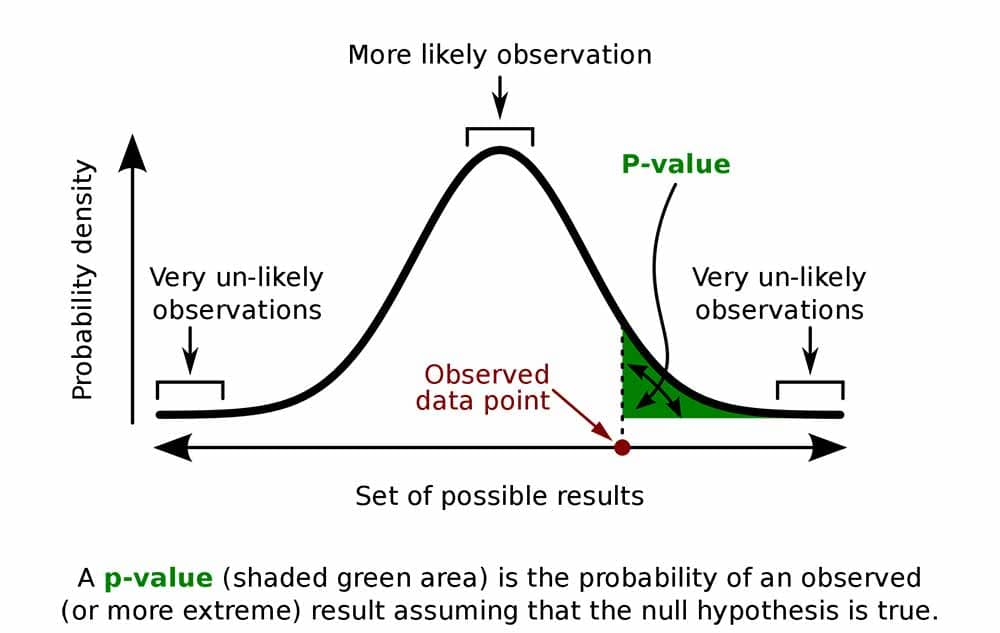
This figure illustrates how the p-value represents the probability of observing an outcome as extreme as the test statistic under the null hypothesis. The shaded tail area shows unlikely outcomes if H0H_0H0 is true. Although the diagram includes extra labels such as “more likely” and “very unlikely,” these additions support conceptual understanding while slightly exceeding syllabus wording. Source.
Interpreting a Rejected Null Hypothesis
A decision to reject H₀ occurs when the p-value is less than or equal to α. This outcome signals that the observed sample difference is unlikely to be due to random variation alone. Therefore, the evidence supports the claim that the population means differ.
Key points when justifying a claim after rejecting H₀:
Emphasize that the data provide statistically significant evidence of a difference between population means.
Link the direction of the difference to the research context, depending on the form of the alternative hypothesis.
Avoid overstating results; statistical significance does not imply practical significance.
Clearly indicate that the conclusion is based on probability rather than certainty.
This interpretation reinforces that significance tests supply evidence, not proof, and that claims should remain appropriately qualified.
Interpreting a Failure to Reject the Null Hypothesis
Failing to reject H₀ means the p-value is greater than α. In this case, the data do not provide strong evidence against the assumption of no population difference. Importantly, this does not prove that the null hypothesis is true; it only indicates insufficient evidence to support the alternative claim.
When justifying claims in this scenario:
Note that statistical evidence does not support a difference between population means.
Clarify that the result reflects limited evidence, not confirmation of equality.
Tie the justification back to study conditions, including sample size and variability, which influence power and detectability of effects.
A careful justification recognizes the limitations inherent in non-rejection decisions and avoids implying definitive equivalence between population means.
Connecting Test Outcomes to Contextual Claims
Because statistical inference always operates within a real-world setting, effective justification must incorporate context. Claims must be explained by explicitly relating test results to the populations, variables, and research question under investigation.
Strong contextual justification includes:
Stating the claim in terms of population means, not sample means.
Referencing the evidence from the test statistic and p-value.
Using language that highlights uncertainty, such as “the results provide evidence that…” or “there is not sufficient evidence to conclude that…”.
Context-based explanation is essential because significance tests do not exist independently of the phenomena they evaluate. By embedding reasoning within the study scenario, claims become clearer, more accurate, and more statistically meaningful.
The Role of Evidence in Supporting or Refuting Claims
Ultimately, the justification of claims relies on aligning the research statement with the statistical decision. The evidence either supports a claim of difference or suggests that current belief in no difference should be maintained. The strength of justification stems from how well the argument integrates the p-value interpretation, hypothesis structure, and contextual understanding of population means.
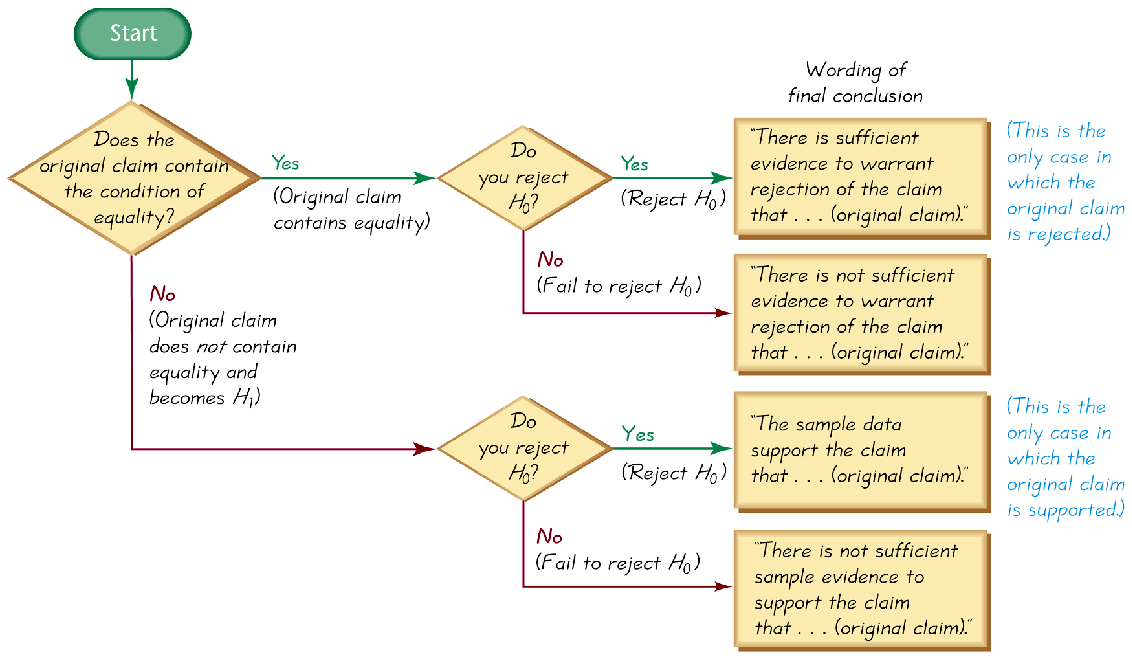
This flowchart demonstrates how the decision from a significance test translates into a written conclusion about evidence for or against a claim. It highlights the difference between rejecting H0H_0H0 and failing to reject it, emphasizing how each outcome shapes the justification of a claim. The diagram includes additional phrasing about data being “surprising” under H0H_0H0, which slightly extends beyond syllabus wording but remains conceptually helpful. Source.
FAQ
The strength of evidence depends on how small the p-value is relative to the significance level. A p-value only marginally below the threshold provides weaker support than one that is substantially smaller.
Very small p-values indicate that the observed difference is highly inconsistent with the null hypothesis, giving stronger justification when supporting a claim of differing population means.
However, confidence should still be expressed in probabilistic terms, as significance tests cannot establish certainty.
The alternative hypothesis determines which population differences count as evidence against the null. When justifying claims, conclusions must match the direction specified.
For example:
• A one-sided alternative allows claims about one mean being greater or smaller.
• A two-sided alternative only justifies claims that the means are different, not the specific direction of the difference.
Linking the conclusion to the correct form of the alternative avoids overstating what the data support.
Contextual wording clarifies which populations the claim refers to and prevents misinterpretation of statistical results. Without context, a conclusion may appear overly general or detached from the actual study.
Including population names, variables measured, and direction of comparison ensures the reasoning accurately reflects the research setting.
It also communicates limitations, such as sample-specific variability, that affect how broadly the claim may be applied.
Two tests with identical p-values may not provide equally strong justification if their sample sizes differ.
Large samples detect small differences more easily, meaning a small p-value may reflect a trivial difference.
Small samples may fail to detect meaningful differences, making non-significant results less informative.
When justifying claims, it is good practice to acknowledge whether the sample size strengthens or weakens the evidence for or against the claim.
Common errors include:
• Claiming proof that the null hypothesis is true when it is not rejected.
• Overinterpreting statistically significant results as practically meaningful.
• Ignoring the direction or form of the alternative hypothesis.
• Failing to reference the study context when explaining the conclusion.
Avoiding these mistakes ensures that claims are justified with accurate, careful, and contextually grounded reasoning.
Practice Questions
Question 1 (1–3 marks)
A study compares the mean reaction times of two independent groups. A two-sample t-test produces a p-value of 0.012 when testing whether the population means differ.
Explain, in context, whether the researcher is justified in claiming that the population means are different. The significance level is 0.05.
Question 1
• States that the p-value (0.012) is less than the significance level (0.05). (1 mark)
• Concludes that the null hypothesis should be rejected. (1 mark)
• States that the researcher is justified in claiming a difference in population means, in context. (1 mark)
Total: 3 marks
Question 2 (4–6 marks)
A researcher investigates whether there is a difference in the mean daily water consumption between households with water-saving devices and those without. A two-sample t-test is carried out using random samples from each population. The test yields a test statistic of t = -1.48 with an associated p-value of 0.167 when testing H0: mean1 - mean2 = 0 against Ha: mean1 - mean2 ≠ 0.
(a) Using the p-value, state the appropriate decision at the 5% significance level.
(b) Explain whether the researcher is justified in claiming that the populations differ in their mean daily water consumption.
(c) Comment on why failing to reject the null hypothesis does not prove that the population means are equal.
Question 2
(a)
• Identifies that the p-value (0.167) is greater than 0.05. (1 mark)
• States that the null hypothesis should not be rejected. (1 mark)
(b)
• States that the researcher is not justified in claiming a difference in population means. (1 mark)
• Explanation refers to insufficient evidence rather than equality of means. (1 mark)
(c)
• States that failing to reject the null hypothesis does not prove it true. (1 mark)
• Explains that the result may be due to limited evidence, sample size, or variability, meaning a true difference could still exist. (1 mark)
Total: 6 marks
