
AP Syllabus focus:
‘Discuss the concept of variation in the context of categorical data analysis, emphasizing that differences between observed data and expected frequencies can arise due to chance or reflect a real effect.
- Explain how statistical tests, specifically chi-square tests, are designed to distinguish between these types of variation, helping to determine whether the observed deviations from expectations are statistically significant or likely due to random variation.’
Understanding variation between observed and expected counts helps reveal when differences arise from chance or when they imply a meaningful effect in categorical data settings.
Understanding Variation in Categorical Data
In categorical data analysis, variation naturally appears when observed counts differ from expected counts, and understanding this difference is essential for interpreting patterns. Observed counts represent the actual frequencies recorded in each category of a study, whereas expected counts represent the frequencies predicted under a specific assumption, typically the null hypothesis, which proposes a particular distribution or relationship. Because sampling variability is always present, some difference between these two sets of counts is normal, and distinguishing chance variation from a genuine effect becomes a central goal in inference for categorical data.
What Observed and Expected Counts Represent
Observed counts are the direct outcomes of data collection, such as survey responses or tallied classifications. Expected counts, however, reflect what the distribution of counts would look like if the model or assumption holding under the null hypothesis were true. When observed counts diverge from expected values, the key question becomes whether this deviation is consistent with typical random variation or large enough to suggest a statistically meaningful discrepancy.
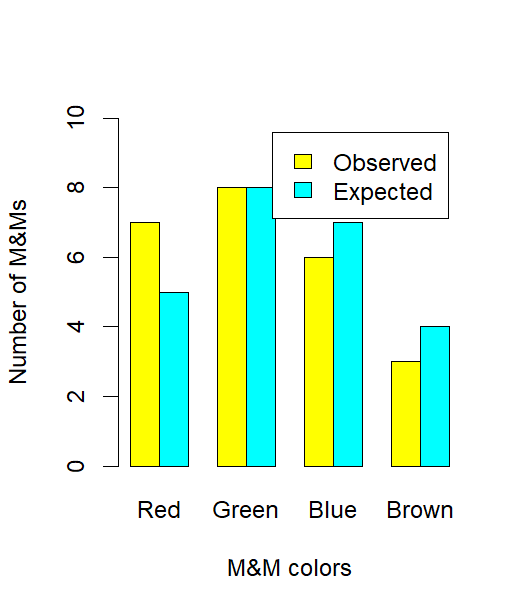
This chart compares observed and expected counts for four M&M colors, illustrating how sample outcomes rarely align perfectly with expected distributions. The differences shown represent ordinary variation unless large enough to imply a real effect. The candy context provides additional detail but supports understanding of observed–expected discrepancy. Source.
Observed Count: The actual recorded frequency in each category of a categorical variable.
A brief comparison of observed and expected values helps determine whether natural fluctuations provide a sufficient explanation or whether the data offer evidence against the assumed distribution. This reasoning lays the foundation for applying chi-square methods.
Why Variation Occurs
Variation between observed and expected counts arises for two primary reasons: chance and real effects. Chance variation refers to the natural randomness inherent in sampling. Even when a population follows an exact distribution, repeated random samples will rarely match that distribution perfectly. Real effects occur when differences are too pronounced to be plausibly explained by randomness alone, indicating that the underlying distribution may not follow what the null hypothesis proposes.
Chance Variation
Chance variation is expected whenever data are collected from a sample. Slight discrepancies between the observed and expected counts typically do not signal meaningful differences in the population. As samples grow larger, chance variation becomes more predictable and facilitates more accurate assessments of whether differences could reasonably result from sampling randomness.
Real (Systematic) Effects
Real effects are differences suggesting that the model outlined in the null hypothesis may be incorrect. When discrepancies are substantial or patterned, they may point toward a meaningful departure from the expected distribution. Identifying real effects is essential for answering research questions about population characteristics and relationships.
The Role of Chi-Square Tests
Chi-square tests, particularly the chi-square test for goodness of fit, are designed to evaluate whether the variation between observed and expected counts can be attributed to chance or whether it indicates a statistically significant deviation. These tests compare the size of the discrepancies to what would typically be expected due to randomness. A larger test statistic implies greater inconsistency between observed outcomes and the null hypothesis.
EQUATION
= Chi-square statistic measuring overall deviation
= Observed count in a category
= Expected count in that category
This statistic becomes the central tool for determining how unusual the observed results are under the assumption that the expected distribution is correct.
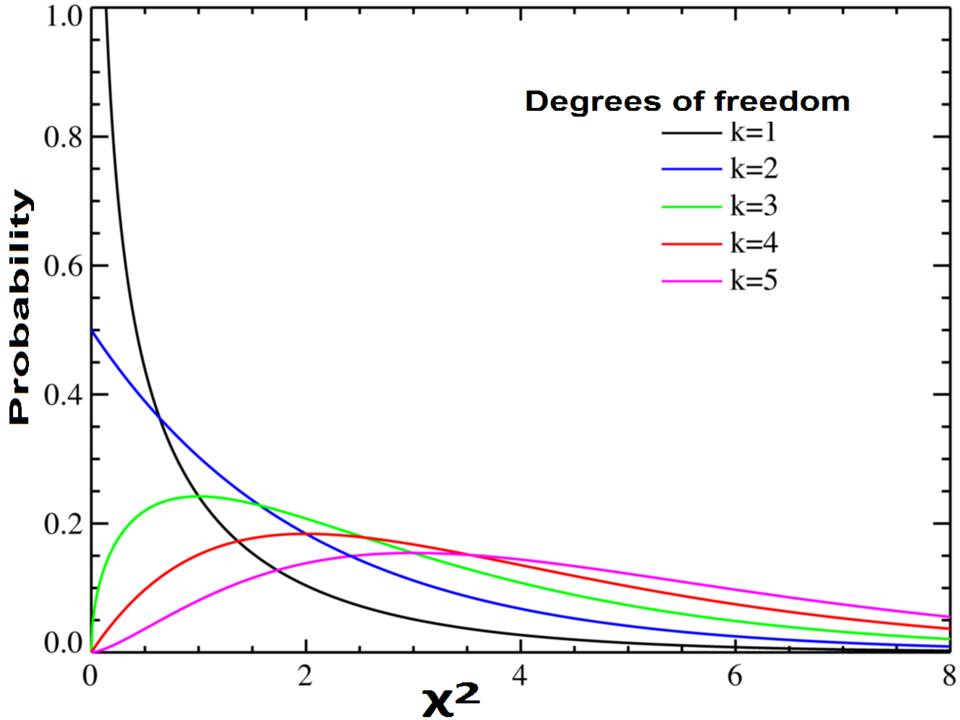
This plot displays chi-square probability density functions for several degrees of freedom, highlighting how large chi-square values fall in low-probability regions. These tails represent outcomes unlikely under the null hypothesis, clarifying why unusually large discrepancies between observed and expected counts suggest meaningful effects. The inclusion of multiple curves adds contextual detail beyond the syllabus but strengthens conceptual understanding. Source.
A chi-square test works by quantifying the collective discrepancies across all categories rather than examining any single difference in isolation. This approach allows the test to detect subtle but consistent departures from the hypothesized distribution as well as large and obvious discrepancies.
Distinguishing Chance from Meaningful Differences
The essential purpose of chi-square tests is to differentiate between random variation and statistically significant variation. When the chi-square statistic is small, the differences between observed and expected counts align with what chance variation would predict. When the statistic is large, the deviations are unlikely to have occurred purely by chance, providing evidence against the null hypothesis.
Assessing Statistical Significance
After computing the chi-square statistic, analysts compare it to a chi-square distribution associated with the appropriate degrees of freedom. This comparison yields a p-value, which reflects the probability of obtaining a chi-square statistic as large as the one computed if the null hypothesis were true. Lower p-values indicate that the observed differences are unlikely to be caused by random variation alone.
Interpreting Deviations in Context
The context of a study is crucial when interpreting variation. Even when a statistical test suggests significance, the practical consequences depend on the nature of the categorical variable, the research question, and the magnitude of the discrepancies. Understanding both statistical outcomes and contextual meaning ensures that results are interpreted responsibly and accurately within the framework of categorical data analysis.
FAQ
Statistical tests focus on whether discrepancies are unlikely to occur by chance, but practical meaning depends on the size and consequences of the difference.
A small statistical deviation may have little real-world impact, while a moderate deviation in a sensitive context (such as medical testing or quality control) might matter greatly.
Evaluating effect size, context, and potential outcomes helps determine whether the observed variation is practically significant.
As sample size increases, expected counts become more stable, while observed counts can still fluctuate slightly.
Large samples reduce random noise, so even relatively small deviations between observed and expected values can appear more noticeable.
With more data, subtle effects that were previously hidden become apparent, making expected counts seem more rigid than before.
While no formal conclusion can be drawn without a test, certain patterns can hint at a real effect:
• Consistent overrepresentation or underrepresentation across several categories
• A single category deviating far more than others
• Patterns aligning with a theoretical or contextual explanation
These cues help identify whether differences are worth investigating further.
Expected counts scale with sample size, ensuring fair comparison across different datasets.
Proportional expectations reflect underlying assumptions about population behaviour, such as equal likelihoods or established ratios.
Using proportions prevents misleading conclusions that could arise if absolute counts were incorrectly assumed to stay constant across samples.
Sampling method affects both accuracy and variability.
Random sampling tends to create variation that is purely due to chance, which chi-square tests are designed to evaluate.
Non-random methods, such as convenience sampling, may introduce systematic biases that mimic meaningful effects, inflating differences between observed and expected counts.
Practice Questions
A researcher compares the observed counts of four categories to the expected counts under a stated model. Explain why small differences between observed and expected counts may occur even when the model is correct.
(1–3 marks)
• States that differences can arise due to natural sampling variation or chance. (1 mark)
• Notes that even if the model is correct, observed counts will rarely match expected counts exactly. (1 mark)
• Shows understanding that small discrepancies do not necessarily imply the model is wrong. (1 mark)
A wildlife biologist records the number of birds observed in four habitat types: forest, grassland, wetland, and farmland. She expects the birds to be equally distributed across the habitats, based on previous ecological studies. Her observed counts for a sample of 200 birds are noticeably different from the expected counts.
(a) Explain why these differences might arise from chance alone.
(b) Explain how a chi-square test helps determine whether the differences indicate a real ecological preference.
(c) In context, describe what it would mean if the chi-square statistic were very large.
(4–6 marks)
(a)
• Identifies that sampling variability can cause observed counts to differ from expected counts even when the true distribution is equal. (1 mark)
• Mentions randomness or chance variation as part of any sampling process. (1 mark)
(b)
• States that the chi-square test compares observed and expected counts to measure how large the discrepancies are. (1 mark)
• Explains that the test determines whether the observed differences are too large to be attributed to chance alone. (1 mark)
(c)
• States that a very large chi-square statistic indicates the observed distribution is unlikely if the expected distribution were true. (1 mark)
• Interprets this in context: suggests birds may prefer certain habitats rather than being equally distributed. (1 mark)
