
AP Syllabus focus:
‘A confidence interval provides a range of values for the slope that, based on sample data, is likely to include the true population slope. This range can be used to support or refute claims about the relationship between the variables in the context of the data. Discussing the confidence interval's bounds allows for the evaluation of hypotheses or claims regarding the slope's value.’
Confidence intervals for a regression slope allow statisticians to assess whether sample evidence supports or contradicts claims about population relationships, using interval bounds to evaluate plausible values for the true slope.
Understanding Claims in the Context of Regression Slopes
A confidence interval for the slope represents a range of plausible values for the population slope β, based on sample data. This range reflects sampling variability and helps determine whether the data provide evidence supporting or refuting a claim about the linear relationship between two quantitative variables.
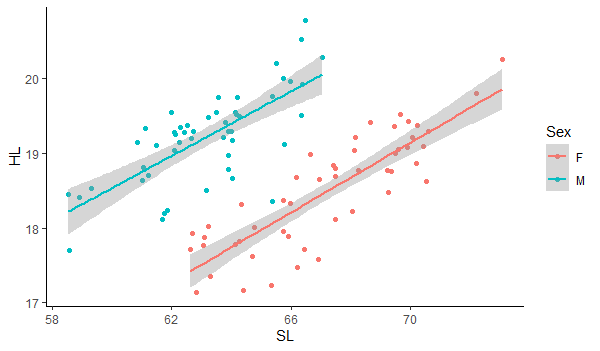
Scatter plot of head length versus standard length for fish, with separate regression lines and shaded confidence intervals for each sex. The shaded bands show the range of plausible lines supported by the sample data, illustrating uncertainty in the estimated slopes. The presence of two groups is extra detail beyond the syllabus, but reinforces how confidence intervals help justify claims about relationships in different populations. Source.
How Confidence Intervals Support or Refute Claims
A claim about a population slope asserts something about the strength or direction of the relationship between variables. A confidence interval allows us to test whether that claim is consistent with plausible values of β. If the claimed value lies inside the interval, the claim is considered plausible; if it lies outside, the claim is not supported by the sample evidence.
Interpreting Interval Bounds in Context
Because interval bounds indicate the range of slopes compatible with the data at a chosen confidence level, the meaning of the interval directly informs the evaluation of claims.
If zero is not in the interval, the data support the presence of a linear relationship.
If zero is included, the data do not rule out the possibility of no linear relationship.
If a specific claimed slope value falls outside the interval, evidence contradicts that claim.
If the claimed value lies within the interval, the claim remains consistent with the sample data.
These interpretations rely on the foundational idea that in repeated sampling, about C% of constructed intervals will capture the true population slope.
Key Terminology for Justifying Claims
Confidence Interval for a Slope: A range of plausible values for the true population slope β, constructed using sample data and reflecting sampling variability.
After introducing a definition, continue with clear explanation to reinforce conceptual understanding. In this case, noting how confidence intervals reflect uncertainty helps students appreciate why claims must be assessed relative to the entire interval rather than a single estimate.
Why Confidence Intervals Allow Claim Evaluation
Confidence intervals incorporate both the point estimate (the sample slope b) and the standard error, which captures variability across hypothetical repeated samples.
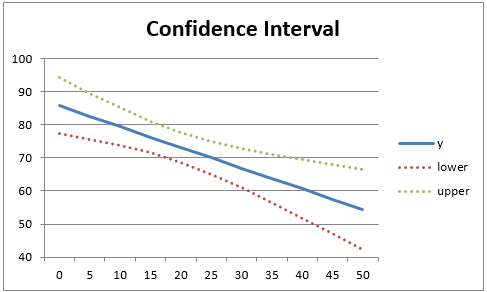
Regression confidence interval chart showing a fitted line with dotted curves above and below representing a 95% confidence band for the mean response. The band illustrates how the combination of the sample slope and its standard error yields a range of plausible regression lines, which can be used to support or refute claims about the underlying relationship. The chart also shows variation in uncertainty across predictor values, a nuance beyond the core AP syllabus. Source.
These elements ensure that the interval represents not just the best estimate of β but also the uncertainty associated with sampling.
Evaluating claims through this interval approach aligns with statistical reasoning: decisions are made based on whether the data’s estimated range of plausible slopes aligns with the stated claim about the population.
Using Confidence Intervals in Statistical Arguments
When justifying a claim, students should rely on clear, context-driven statistical arguments. Strong justifications reference all three components:
The claim about β
The confidence interval bounds
The relationship between the claim and the interval
Essential Points for Justifying Claims
A claim is supported when its proposed value of β falls within the interval.
A claim is not supported when its proposed value lies outside the interval.
Claims about the existence of a relationship depend on whether zero is included.
Claims about the direction of a relationship depend on the sign of all values in the interval.
Any justification should reference the population represented by the sample.
A normal explanatory sentence must follow any equation box when included, ensuring clarity and flow.
Evaluating the Strength of Evidence
Confidence intervals also convey how strong the evidence is:
Narrow intervals provide more precise information about β, strengthening argumentation.
Wide intervals indicate greater uncertainty, requiring more cautious claims.
If the interval narrowly excludes or includes a value, evidence may be borderline.
Large gaps between the claim and interval bounds indicate strong contradiction.
This aligns with the syllabus emphasis on using interval bounds to evaluate hypotheses and claims regarding relationships between variables.
Communicating Justifications Effectively
Students should structure their justification using quantitative and contextual reasoning:
State the interval clearly.
Refer explicitly to the claim value.
Compare the claim to the interval bounds.
Describe what the interval implies about the population slope.
Connect the argument to the study context.
This approach mirrors the reasoning used in formal inference while reinforcing the connection between sample data and population conclusions.
FAQ
A confidence interval clarifies whether the data allow for a small but meaningful slope or whether zero remains a plausible value.
If the interval is extremely narrow and still includes zero, it suggests the relationship is genuinely weak.
If the interval is wide and includes zero, the data may simply lack precision, meaning a weak relationship cannot be distinguished from no relationship.
A small sample slope does not necessarily imply a negligible relationship. What matters is whether the interval excludes values that contradict the claim.
If the interval lies entirely on one side of zero, even a modest slope may be statistically meaningful.
The interval captures the range of slopes compatible with the sample, allowing claims to be justified beyond the point estimate alone.
Higher confidence levels (such as 99%) produce wider intervals, potentially making it harder to justify claims because more values become plausible.
Lower confidence levels (such as 90%) narrow the interval, increasing precision but reducing certainty.
Choosing the level involves balancing evidence strength and acceptable uncertainty in context.
Yes. Visual patterns can be misleading when scatter is high or sample size is small.
A scatterplot may suggest a positive or negative association, but a confidence interval that includes zero indicates that the sample does not provide reliable evidence of a true population trend.
This highlights the importance of using numerical inference rather than relying solely on visual impressions.
A contextually sound justification connects the interval’s bounds to the real-world meaning of the slope.
This means translating the slope’s plausible values into what they imply for the variables being studied.
Effective justifications mention the population, the variables’ interpretation, and whether the interval supports or challenges the claim being assessed.
Practice Questions
Question 1 (1–3 marks)
A researcher constructs a 95% confidence interval for the slope of a regression line relating study hours (x) to exam score (y). The interval is from 0.12 to 0.46.
Based on this interval, is the claim that “there is no linear relationship between study hours and exam score” supported by the data? Justify your answer.
Mark Scheme: Question 1
• 1 mark: States correctly that the claim is not supported.
• 1 mark: Identifies that 0 is not contained in the interval.
• 1 mark: Explains that because all plausible slopes are positive, the data provide evidence of a positive linear relationship.
Question 2 (4–6 marks)
A conservation biologist investigates whether the population density of a species (x) predicts average nest success rate (y) across study sites. A 90% confidence interval for the slope of the regression model is from –0.18 to 0.05.
Using this interval, evaluate the claim that “increasing population density decreases nest success rate.” In your answer, refer to:
• whether the claim is supported,
• what the interval suggests about plausible values of the population slope,
• what this means in context for the species studied.
Mark Scheme: Question 2
• 1 mark: States correctly that the claim is not supported by the interval.
• 1 mark: Identifies that the slope interval includes 0.
• 1 mark: Notes that the interval contains both negative and positive plausible slopes.
• 1 mark: Explains that because 0 is plausible, the data do not rule out no linear relationship.
• 1 mark: Connects interpretation to context: the data do not provide strong evidence that density affects nest success rate.
• 1 mark: Adds that while slight decreases are plausible (negative values), slight increases are also plausible, so direction cannot be determined from this interval.
