
AP Syllabus focus:
‘In repeated random sampling of the same size, about C% of the confidence intervals will contain the true slope of the population regression line. An interpretation of a confidence interval for the slope should include reference to the sample and the population it represents, emphasizing the probabilistic nature of confidence intervals in capturing the true slope.’
Understanding how to interpret a confidence interval for a regression slope helps quantify uncertainty and clarify what sample-based evidence suggests about a population-level linear relationship.
Interpreting Confidence Intervals for Regression Slopes
A confidence interval for the slope of a regression model provides a range of plausible values for the true population slope, denoted β, based on a single sample.
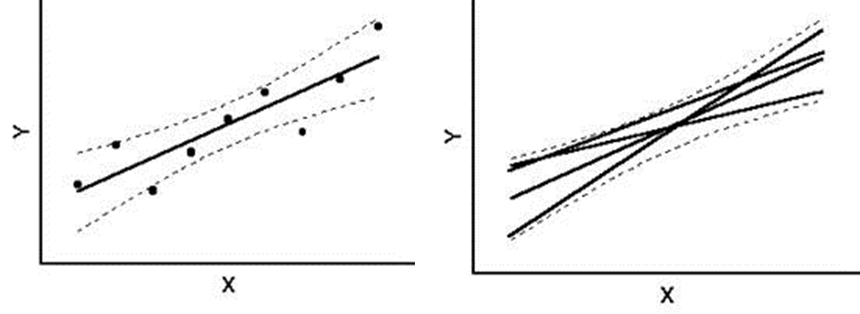
This figure displays a fitted regression line with its 95% confidence band, showing where the population regression line is likely to lie and illustrating that multiple plausible slopes fit within the band. Source.
This interpretation is rooted in the idea that repeated random sampling produces different sample slopes, each generating its own interval. About C% of those intervals will include the true slope, reflecting the probabilistic nature of confidence intervals emphasized in the specification.
Because students often interpret confidence intervals incorrectly, it is essential to distinguish between what they do and do not tell us. A valid interpretation must describe the population, connect the interval to the sampling process, and acknowledge uncertainty.
Understanding the Role of Sampling Variation
The specification highlights that intervals depend on repeated random sampling. Each new sample yields slight differences in the observed slope, the standard error, and thus the width and position of the confidence interval. This sampling variation explains why an interval represents a range of plausible values, not a guarantee about where the true slope lies in a specific sample.
Confidence level refers to the long-run performance of the method, not the probability that β lies in the particular interval you calculated. After an interval is computed, β is either inside or outside it; probability statements refer only to the process, not the final result.
Key ideas about sampling and interpretation
The confidence interval is constructed from sample data but is designed to generalize to a wider population.
Interpretation must reference both the sample and the population regression line.
The meaning of “C% confidence” concerns long-run capture rate, not the chance that β falls in the current interval.
The interval reflects uncertainty due to sampling variability and quantifies how strongly the data support different possible slope values.
Components Required for a Correct Interpretation
To meet the expectations of the syllabus, a complete interpretation should include these elements:
1. Reference to the confidence level
This expresses the long-run method reliability. Students must avoid phrasing that implies uncertainty about the true slope itself.
2. Reference to the population slope
Explicit mention of the population regression line (µy = α + βx) anchors the interpretation in the correct inferential target.
3. Reference to the sample
Interpretation should acknowledge that the interval arises from this particular sample and is one of many intervals that could have been produced from repeated sampling.
4. Explanation of plausibility
Values inside the interval are considered plausible estimates for β; values outside are not consistent with the sample data at the stated confidence level.
A well-formed interpretation therefore communicates: the interval is based on sample data, it estimates the population slope, and the confidence level describes long-run accuracy of the method.
Interval Structure and Meaning
A confidence interval for the slope typically has the form:
point estimate ± margin of error, where the point estimate is the sample slope b. While the guideline for this subsubtopic does not require students to compute intervals, it expects them to understand how their structure informs interpretation.
When the interval contains only positive numbers, it indicates the sample data provide evidence of a positive association in the population. When the interval contains only negative numbers, it suggests a negative association. When the interval includes zero, the data do not provide convincing evidence of a linear relationship between variables at the stated confidence level.
When this context is described, students can identify whether claims about the population relationship are supported.
Definition of a Confidence Interval for a Slope
Confidence Interval for the Population Slope (β): A range of plausible values for the true population slope, constructed from sample data so that C% of such intervals produced by repeated random sampling will contain β.
This definition aligns with the specification’s emphasis on probabilistic interpretation and the link between sample and population.
A confidence interval gains meaning only when interpreted within the context of the study, so students should explicitly connect the variables and describe the relationship being investigated. This context-specific framing allows them to apply the probabilistic interpretation appropriately and evaluate claims about the population slope.
Interpreting a Confidence Interval in Context
A strong contextual interpretation includes the following elements:
The calculated interval (even if not numerically shown here) represents plausible values for β, the slope of the population regression line relating the two variables.
If we repeatedly took random samples of the same size and constructed a confidence interval from each, about C% of those intervals would contain the true population slope.
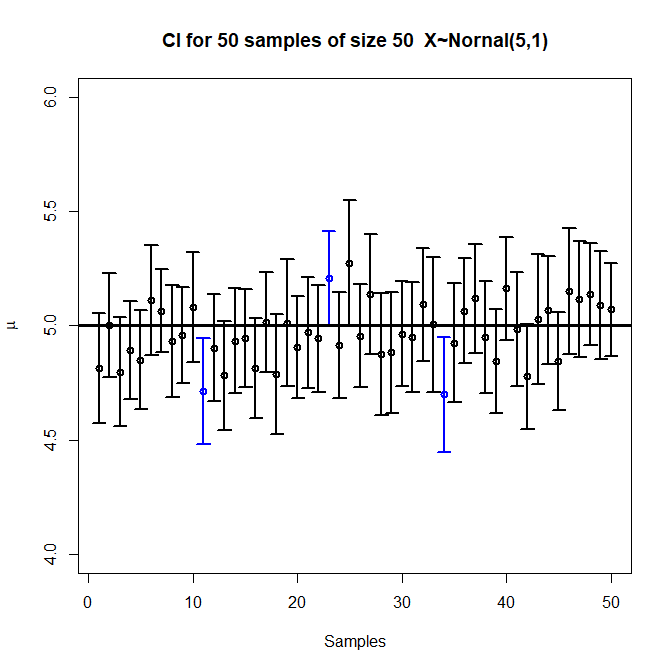
Each horizontal interval represents one sample’s confidence interval, illustrating that most intervals contain the true value while a small portion do not, reflecting long-run C% coverage inherent to confidence interval methods. Source.
Because this interval comes from one such sample, it provides a data-based estimate of the range of slopes consistent with the observed relationship.
Connecting back to context, the interpretation should specify what a unit change in x represents and how y is expected to change on average.
Using Confidence Intervals to Evaluate Claims
Although this subsubtopic focuses on interpretation rather than decision-making, interpretation naturally informs whether data support certain claims. If a proposed value of β lies within the interval, it is consistent with the data; if not, the data cast doubt on that value. This perspective strengthens students’ conceptual understanding and prepares them for subsequent inference topics without extending beyond the specified learning target.
FAQ
A confidence interval for a slope describes the range of plausible values for how much the response variable is expected to change, on average, for a one-unit change in the explanatory variable. This makes the interpretation relational rather than descriptive.
By contrast, a confidence interval for a mean describes plausible values for a single population parameter, not a relationship between two variables.
The slope interval therefore carries directional meaning and implications for the strength and sign of a linear association.
Students often incorrectly state that there is a C% probability the true slope lies in the calculated interval. The correct interpretation refers to long-run capture rates of the method, not the specific interval.
Another frequent error is failing to mention both the sample and the population in the interpretation.
Students should also avoid implying causation unless the data come from a properly designed experiment.
Confidence intervals estimate population parameters. Without mentioning the population, the interpretation lacks clarity about the generalisation being made.
Referring only to the sample suggests the interval describes sample-specific behaviour, which is incorrect; the purpose of inference is to move beyond the sample.
This distinction ensures students correctly communicate what the slope interval is intended to infer.
Yes. If zero lies within the interval, it does not prove the slope is zero; it simply indicates insufficient evidence to rule out zero as a plausible value.
If zero is not included, this suggests the data provide evidence of a non-zero slope, but it still does not confirm the exact value of the slope.
Students should interpret presence or absence of zero as a statement about plausibility, not certainty.
Larger samples tend to produce narrower intervals because they reduce sampling variability, making the estimate more precise.
A narrower interval allows for stronger statements about the plausibility of specific slope values.
Smaller samples, by contrast, produce wider intervals that may span values implying very different population relationships, making interpretation less definitive.
Practice Questions
Question 1 (1–3 marks)
A researcher constructs a 95% confidence interval for the slope of the population regression line between study time (hours per week) and exam score. The interval is 0.8 to 2.4.
Explain, in context, what this interval means.
Question 1 (1–3 marks)
Award up to 3 marks:
1 mark for referencing that the interval provides a range of plausible values for the true population slope.
1 mark for describing the long-run interpretation (i.e., 95% of intervals from repeated random samples would contain the true slope).
1 mark for contextualising the interpretation (e.g., for each additional hour of study, exam score is predicted to increase by between 0.8 and 2.4 points on average).
Question 2 (4–6 marks)
A biologist studies the relationship between the amount of sunlight a plant receives (measured in hours per day) and its weekly growth (in millimetres). Using a random sample of 40 plants, the biologist calculates a 90% confidence interval for the slope of the regression line relating sunlight to plant growth: 0.12 to 0.38.
Answer the following:
a) Interpret this confidence interval in the context of the study.
b) Based on the interval, comment on whether the data provide convincing evidence of a positive linear association between sunlight and plant growth.
c) Explain how the interpretation would change, if at all, if a 99% confidence interval were used instead.
Question 2 (4–6 marks)
a) Interpretation (2 marks)
1 mark for stating that the interval gives plausible values for the true population slope.
1 mark for correctly placing the interpretation in context (for each extra hour of sunlight per day, plant growth is expected to increase by between 0.12 and 0.38 mm per week on average).
b) Evidence of positive association (1–2 marks)
1 mark for noting that the interval contains only positive values.
1 mark for concluding that this provides convincing evidence of a positive linear association in the population.
c) Effect of using a 99% interval (1–2 marks)
1 mark for stating that a 99% interval would be wider due to greater confidence.
1 mark for explaining that the interpretation regarding long-run capture rate changes, not the meaning of the observed interval itself; whether the association remains convincing depends on whether the wider interval still excludes zero.
Total: 6 marks.
