
AP Syllabus focus:
‘The null hypothesis (H0) posits no effect or difference, stating that the slope (β) equals a hypothesized value (β0). Alternative hypotheses (Ha) suggest the slope is not equal to, less than, or greater than the hypothesized value, indicating a directional effect or difference.’
Formulating hypotheses for a regression slope requires distinguishing between claims of no linear relationship and claims suggesting the slope differs in meaningful or directional ways.
Understanding the Role of Hypotheses in Regression Inference
In inference for regression slopes, hypotheses structure the question being investigated and clarify what the sample data will be used to test. Because regression analysis examines the population slope (β), every hypothesis statement focuses on whether evidence supports a claim that the slope differs from a specified value, typically zero. When the slope equals zero, no linear association exists between the predictor (x) and response (y) variables. Understanding what each hypothesis represents is essential before evaluating statistical evidence.
The Null Hypothesis (H0): Describing No Effect
The null hypothesis plays a foundational role in slope testing by asserting that the population slope equals a particular value, usually β₀ = 0 unless context dictates otherwise. This establishes a benchmark against which sample data are compared.
Null Hypothesis (H0): A claim stating that the population slope β equals a hypothesized value β₀, representing no linear effect or no difference.
The chosen value β₀ depends on the research question. Most often the hypothesis tests whether there is no linear relationship, making β₀ = 0 the default expectation. By assuming this claim is true, statistical procedures evaluate how unusual the observed sample slope would be under this assumption.
The Alternative Hypothesis (Ha): Indicating a Possible Effect
While the null represents no effect, the alternative hypothesis proposes that the slope differs from the hypothesized value in a way meaningful to the research question. It defines the direction of interest and determines the type of significance test.
Alternative Hypothesis (Ha): A claim suggesting that the population slope β is not equal to, less than, or greater than the hypothesized value β₀, indicating a directional or non-directional effect.
Different forms of Ha reflect different research aims, and each version leads to a specific procedure for evaluating evidence.
Forms of Alternative Hypotheses
The structure of the alternative hypothesis directly affects interpretation and testing. Three standard forms are used depending on the nature of the research question:
Two-Sided Alternative
A two-sided alternative is appropriate when any difference from β₀ is of interest.
Ha: β ≠ β₀
This form tests for any deviation from the hypothesized value, without specifying direction. It is used when investigators are equally interested in increases or decreases of the slope.
A “not equal to” alternative, Ha: β ≠ β0, corresponds to a two-sided test, where unusually large positive or unusually large negative sample slopes both count as evidence against H0.
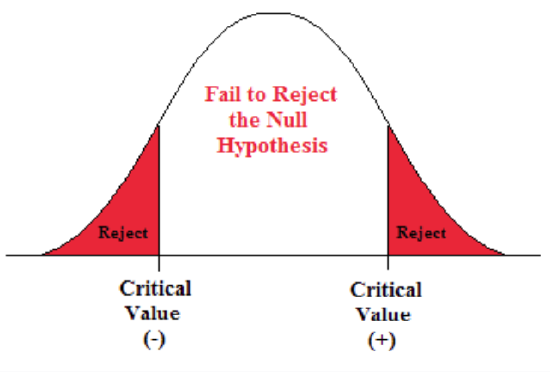
A normal distribution illustrating rejection regions for a two-sided hypothesis test. The red tails represent values of a test statistic extreme enough to contradict the null hypothesis. Although shown for a mean Z-test, the same structure applies to a two-tailed t test for a regression slope. Source.
One-Sided Alternative: Greater Than
If the research question specifically predicts a positive linear association, a one-sided test may be used.
Ha: β > β₀
This alternative reflects expectations that increases in x correspond to increases in y.
One-Sided Alternative: Less Than
When theory or prior evidence suggests a negative linear association, a one-sided negative test is selected.
Ha: β < β₀
This form captures situations where increases in x are expected to correspond with decreases in y.
One-sided tests must be chosen before examining data to avoid bias and ensure valid inference.
Choosing Appropriate Hypotheses
Identifying the correct hypothesis pair demands close attention to the context of the study. Students should evaluate:
The research objective: Does the question ask whether any relationship exists, or does it specify a direction?
Theoretical expectations: Scientific or contextual knowledge may support directional alternatives.
Consequences of wrong decisions: Two-sided tests offer more conservative conclusions when direction cannot be justified.
In regression settings, hypotheses always reference the population slope β, never the sample slope b. The sample slope serves only as evidence used to evaluate the hypotheses.
In simple linear regression, the slope β describes how much the mean of the response variable y changes, on average, for each one-unit increase in the explanatory variable x.
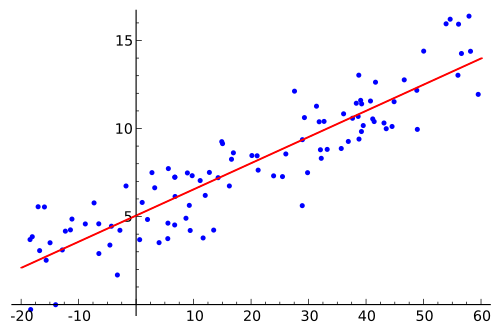
A scatterplot with a fitted regression line illustrating the relationship between an explanatory variable and a response variable. The slope of the line represents the estimated change in mean response per unit increase in the predictor. This visual connects the sample slope bbb to the population slope βββ examined in hypothesis testing. Source.
Relationship Between Hypotheses and Statistical Procedures
The hypothesis pair chosen dictates the structure of the eventual significance test. After formalizing H0 and Ha:
The sample slope b and its standard error inform the test statistic.
The test statistic is evaluated using a t-distribution with n − 2 degrees of freedom, although full testing details belong to other subsubtopics.
The formulation of hypotheses also determines whether p-values represent one- or two-tail probabilities.
Before interpreting results, students must ensure that hypotheses are stated clearly, symbolically, and in words referencing both context and population parameters. Clear articulation prevents misinterpretation and aligns statistical reasoning with real-world questions, reinforcing the central role hypotheses play in regression inference.
FAQ
You should decide based solely on the research question or theoretical expectations, not on what the data appear to show.
• Use a one-sided alternative only when there is a clear, justified directional claim.
• If there is any uncertainty about the expected direction, a two-sided alternative is safer and avoids bias.
Zero represents the claim that there is no linear association between the variables in the population.
It provides a neutral baseline against which evidence of any non-zero relationship can be assessed.
Only when a study aims to test a very specific value for the slope, such as in calibration problems, would a hypothesis use a non-zero beta value.
Yes. Changing the units or scale of either variable changes the numerical value of the slope, so the hypotheses must reference the slope in the transformed model.
However, the logical structure of the hypotheses remains the same:
• H0 always specifies an exact population slope.
• Ha specifies how the true slope differs from that value.
Symbolic notation shows the mathematical claim being tested, while contextual wording ensures you understand what the slope represents in the real situation.
Examiners look for both because regression slopes have meaningful interpretations tied to the variables measured, and clarity prevents miscommunication about what relationship is being tested.
The form of the alternative hypothesis determines which part(s) of the sampling distribution count as evidence against the null.
• A two-sided Ha uses both tails of the distribution.
• A one-sided Ha uses only one tail.
This directly affects the p-value size and therefore the strength of evidence you can claim against the null hypothesis.
Practice Questions
Question 1 (1–3 marks)
A researcher investigates whether the number of hours students revise (x) is linearly associated with their exam score (y). The researcher wishes to test whether there is any linear relationship in the population.
(a) State an appropriate null hypothesis for this test. (1 mark)
(b) State an appropriate alternative hypothesis. (1 mark)
(c) Explain in context what the alternative hypothesis means. (1 mark)
Mark scheme:
• Part (a): 1 mark for stating H0: the population slope beta equals 0 (or there is no linear relationship between hours revised and exam score).
• Part (b): 1 mark for stating Ha: the population slope beta is not equal to 0 (a two-sided alternative).
• Part (c): 1 mark for explaining that the alternative states that hours revised and exam score are linearly related in the population, meaning exam scores tend to increase or decrease as revision hours increase.
Question 2 (4–6 marks)
A conservation scientist studies whether the length of riverbank vegetation (x) predicts the number of fish species found in a stream (y). Previous ecological research suggests that more vegetation should support a greater number of fish species. The scientist plans to carry out a significance test on the slope of a simple linear regression model.
(a) Write suitable null and alternative hypotheses for this test, reflecting the research expectation. (2 marks)
(b) Justify why a one-sided alternative is appropriate in this context. (2 marks)
(c) Explain why hypotheses must be expressed in terms of the population slope rather than the sample slope. (2 marks)
Mark scheme:
• Part (a):
– 1 mark for stating H0: the population slope beta equals 0.
– 1 mark for stating Ha: the population slope beta is greater than 0 (directional alternative consistent with the research expectation).
• Part (b):
– 1 mark for explaining that prior ecological knowledge indicates a positive association is expected.
– 1 mark for stating that, because only increases in the slope are of interest, a one-sided test is suitable.
• Part (c):
– 1 mark for stating that hypotheses must refer to population parameters.
– 1 mark for explaining that the sample slope b is only an estimate used to evaluate the claim about the true population slope beta.
