
AP Syllabus focus:
‘Conditions include: a) Linearity between x and y, verified by residual analysis. b) Constant standard deviation of y across all values of x, checked through residual analysis. c) Independence of observations, ensured by random sampling or experiments. d) Normality of y-values for given x, with sample size considerations to address skewness and outliers.’
Verifying conditions for significance testing in regression ensures that statistical conclusions about the population slope are trustworthy, consistent, and supported by appropriate model assumptions.
Understanding the Purpose of Condition Checks
Before conducting a significance test for the slope of a regression model, students must confirm that the data reasonably satisfy several assumptions. These assumptions justify using the t-distribution to model sampling variability in the estimated slope. Failing to verify conditions risks inaccurate p-values, incorrect conclusions about the population slope, and misleading interpretations about the relationship between variables.
Linearity Condition
Why Linearity Matters
The significance test for the slope relies on the assumption that the true relationship between the explanatory variable x and the response variable y is linear. When this assumption holds, the estimated slope meaningfully reflects how the average value of y changes with x.
Checking Linearity
Students assess linearity primarily through residual analysis, which involves examining how residuals behave relative to the fitted regression line.
Residual: The difference between an observed value of the response variable and its predicted value, .
After plotting residuals versus predicted values or versus x, students look for the following indicators:
Random scatter around zero line
No distinct curves or patterns
No clusters suggesting different subgroups in the data
A visible curve or systematic structure signals that a linear model may be inappropriate.
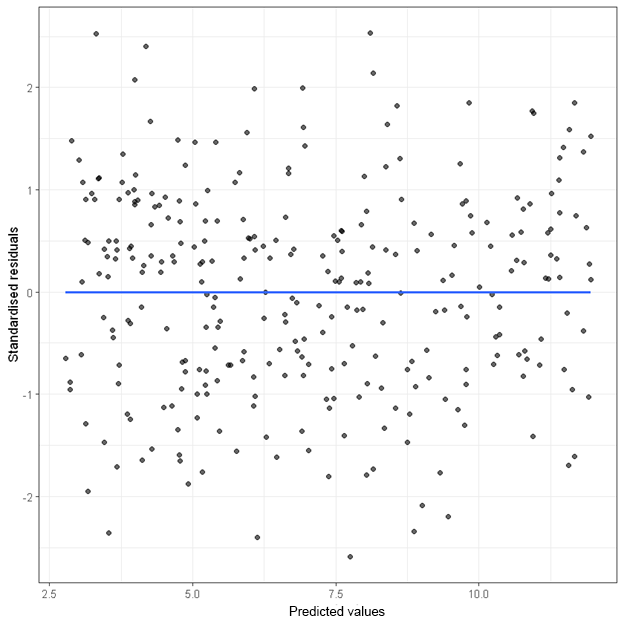
This residual plot shows a random cloud of points centered around zero, supporting both linearity and constant standard deviation assumptions. Its absence of patterns or funnel shapes indicates that the regression model is appropriate with respect to these two conditions. Source.
Constant Standard Deviation Condition
Importance of Equal Variability
The assumption of constant standard deviation (also called homoscedasticity) states that the variability in y should remain roughly the same for all values of x. If variability increases or decreases systematically, standard errors may be distorted, affecting test results.
Checking Homoscedasticity
Residual plots should show:
Scatter that maintains a similar vertical spread across all x
No funnel shapes (indicating increasing or decreasing spread)
No isolated regions of large or small variance
Unequal spread, or heteroscedasticity, weakens reliability of the slope test.
Independence Condition
Why Independence Is Essential
The method for testing the slope assumes that each observation provides unique information. When observations are not independent—such as in time series without proper handling, clustered samples, or repeated measures—standard inferential methods may underestimate or overestimate variability.
Ensuring Independence
Students consider study design to justify independence:
Random sampling from the population
Random assignment in experiments
Avoiding situations where one observation directly influences another
The 10% condition applies when sampling without replacement: the sample size should be less than 10% of the population to ensure approximate independence of observations.
Normality Condition
Role of Normality in Regression Testing
Significance testing for the slope assumes that for any given x, the distribution of y-values is approximately normal. This assumption is especially important when sample sizes are small, as it affects the accuracy of the sampling distribution of the slope.
Checking Normality
Students typically use:
Histograms of residuals
Normal probability (Q–Q) plots
Consideration of skewness and outliers
When sample size is large (n > 30), the t-procedure becomes more robust to departures from normality, due to the central limit theorem’s effect on the sampling distribution of the slope.
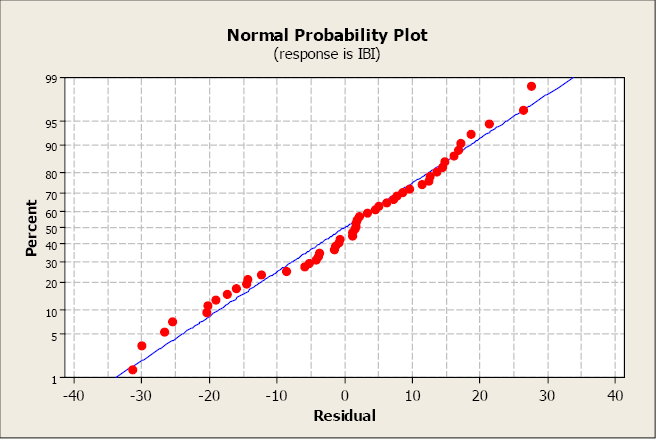
This normal probability plot illustrates how residuals that fall near a straight reference line support the normality assumption. Even though drawn from a specific ecological dataset, the diagnostic pattern applies universally to regression residual checks. Source.
Bringing Conditions Together for Valid Inference
Using Condition Checks to Support a Regression Test
Before performing a significance test for the slope, students systematically review all four conditions:
Linearity ensures the slope has meaningful interpretation.
Constant standard deviation maintains accurate standard errors.
Independence validates the use of the t-distribution.
Normality ensures reliable p-values, especially for small samples.
Meeting these conditions allows the t-test for the slope to provide valid evidence about whether the population slope differs from a hypothesized value. If any condition appears violated, students should note limitations and consider alternative models or data transformations.
This structured verification process strengthens conclusions drawn from regression analysis and reinforces statistical reasoning in evaluating relationships between quantitative variables.
FAQ
A single plot may reveal one type of violation but fail to expose others. For example, a residual plot against x might show a curved pattern, while a normal probability plot highlights non-normality.
Using multiple diagnostics allows different assumptions to be checked independently and reduces the risk of overlooking subtle problems that could distort a significance test for the slope.
With small samples, even mild skewness or a few unusual points can distort p-values because the sampling distribution of the slope may not follow a t-distribution closely.
This increases the chance of incorrect conclusions, so analysts often avoid significance tests or consider transformations when normality concerns arise in small datasets.
Yes. Independence is fundamentally about study design, not visual patterns.
Residual plots cannot reveal dependence created by:
• repeated measurements on the same individual
• cluster sampling
• time-ordered observations with autocorrelation
These design-based issues must be evaluated from contextual information rather than graphical checks.
Randomness alone is not enough: the vertical spread must also remain roughly equal across all fitted values.
A patternless plot still violates constant variance if:
• the residual spread grows or shrinks systematically
• extreme values cluster unevenly
• the centre stays stable but variability changes with x
Thus, the focus is on consistency of spread, not only lack of structure.
Transformations such as logarithms or square roots can stabilise variance, straighten curved relationships, and reduce skewness in residual distributions.
This can make the linear model more appropriate and allow the conditions for significance testing to be met without altering the underlying scientific question.
However, transformations must be justified contextually and interpreted carefully because they change the scale of the variables.
Practice Questions
Question 1 (1–3 marks)
A student fits a least-squares regression line to data relating temperature (x) and electricity usage (y). Before carrying out a significance test for the slope, the student constructs a residual plot. The plot shows a clear curved pattern.
(a) State which condition for significance testing this violates.
(b) Explain why this violation makes a significance test for the slope inappropriate.
Question 1 (1–3 marks)
(a) Identifies the linearity condition as the violated condition.
• 1 mark
(b) Explains that a curved pattern indicates the relationship between x and y is not linear, so the regression model does not appropriately describe the relationship.
• 1 mark
Explains that because the model is inappropriate, the test statistic and p-value for the slope cannot be trusted.
• 1 mark
Question 2 (4–6 marks)
A researcher collects data on the number of hours students revise (x) and their exam scores (y). The researcher wishes to carry out a significance test for the slope of the regression model. The following information is provided:
The residual plot shows random scatter with no visible pattern.
A residuals versus fitted values plot shows roughly equal spread across all predicted scores.
The students were selected using simple random sampling from a large population.
A normal probability plot of residuals shows slight skew but no extreme departures from normality.
(a) Identify whether each of the four required conditions for slope significance testing is satisfied, stating the reason for each.
(b) Based on your assessment, comment on whether it is appropriate to proceed with the significance test for the slope.
Question 2 (4–6 marks)
(a)
• Linearity: satisfied because the residual plot shows random scatter.
1 mark
• Constant standard deviation: satisfied because spread of residuals is roughly equal across fitted values.
1 mark
• Independence: satisfied because simple random sampling from a large population supports independent observations.
1 mark
• Normality: acceptable because only slight skew is present and no strong departures from normality are indicated.
1 mark
(b) Concludes it is appropriate to carry out the significance test because all conditions are met or sufficiently approximated.
Up to 2 marks
Provides justification that the slight skew is unlikely to affect inference, especially if the sample size is moderate or large.
1 mark
(Maximum for question: 6 marks)
