
AP Syllabus focus:
‘A t-test is the appropriate method for testing the slope of a regression model, allowing for inference about the population slope based on sample data.’
Selecting an appropriate testing method for a regression slope is essential for determining whether sample data provide evidence of a linear relationship in the population.
Understanding the Purpose of Testing a Regression Slope
Testing a regression slope focuses on assessing whether the population slope (β) differs from a hypothesized value, usually zero. The slope represents the expected change in the response variable for each one-unit increase in the explanatory variable.
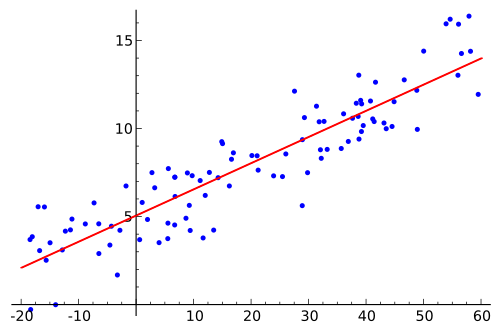
Random data points are displayed along with a fitted straight regression line, illustrating a linear relationship between an explanatory and a response variable. The line’s slope represents the estimated average change in the response variable for each one-unit increase in the explanatory variable. This visualization reinforces why inference about the slope focuses on the strength and direction of the linear trend in the population. Source.
When students evaluate the slope, they are determining whether a meaningful linear association likely exists in the population.
Because sample data contain random variation, slope estimates differ across samples.
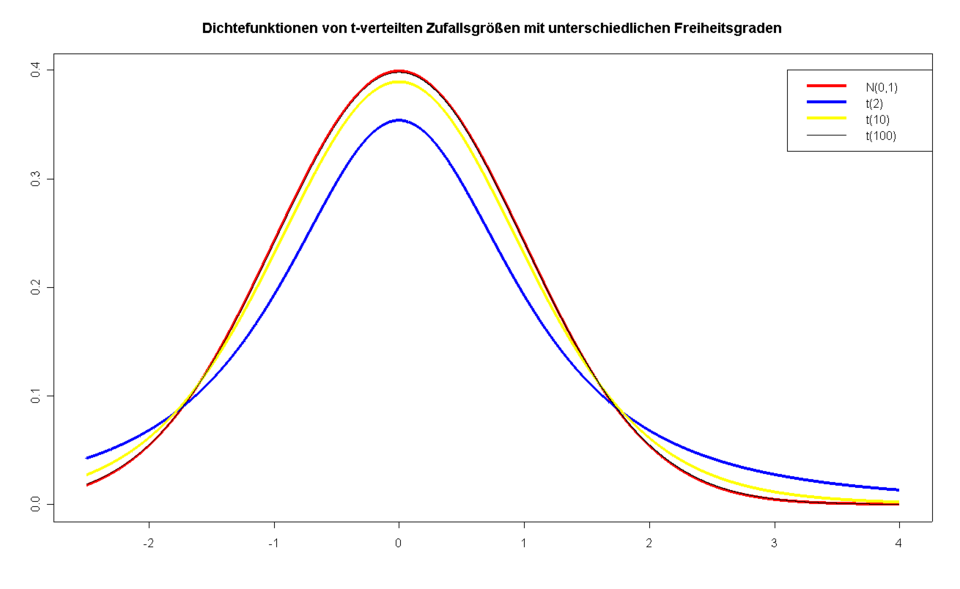
The curves display a standard normal distribution alongside several Student’s t-distributions with different degrees of freedom. The heavier tails of the t-distributions show why t-based methods are used when variability must be estimated from sample data, as in testing a regression slope. The multiple curves for different degrees of freedom provide additional detail beyond the syllabus but help illustrate how the t-distribution approaches the normal distribution as sample size increases. Source.
Statistical testing quantifies how likely the observed slope would be if the hypothesized population slope were true. This reasoning leads naturally to the use of a t-test for the slope, which is the standard inferential method for this purpose.
Why a t-Test Is the Correct Procedure
The central requirement in this subsubtopic is recognizing that a t-test is the appropriate tool for slope inference in simple linear regression. This choice comes from how variation behaves in regression models and from how the standard error of the slope is estimated using sample data rather than known population parameters.
Key reasons the t-distribution is used
The variability of the sample slope is estimated through the standard error of the slope, which incorporates residual variability.
Degrees of freedom for regression slope testing are based on the sample size minus two, reflecting estimation of both slope and intercept.
The sampling distribution of the slope estimate is approximately t-shaped when regression assumptions are met.
These points all reinforce that inference for slopes mirrors other t-based procedures encountered earlier in AP Statistics, but with focus on the linear model structure.
The Role of the Population and Sample Regression Lines
A regression model compares two conceptual lines:
The sample regression line,
The population regression line,
The slope b from the sample regression line serves as an unbiased estimator of the population slope β. When the goal is to test whether β equals a specific value, students rely on the sampling distribution of b. Because the spread of this distribution must be estimated rather than known, the t-test is required.
Before introducing the test statistic itself in later subsubtopics, this section focuses on recognizing when and why the method is appropriate.
Introducing the Test Statistic Framework
Although full computation is not the focus here, students must understand that the t-test compares the observed slope to the hypothesized one, relative to the slope’s standard error.
EQUATION
= Observed sample slope
= Hypothesized population slope
= Standard error of the slope estimate
This expression highlights the logic of the method: the test evaluates how many standard errors the observed slope lies from the hypothesized value. The further the test statistic falls from zero, the stronger the evidence against the null hypothesis.
This equation does not yet require students to compute values but reinforces why the testing method must be t-based.
Situations Requiring a t-Test for the Slope
Students must recognize real context clues indicating when a t-test for the slope is appropriate. Such clues include:
The study investigates whether a linear relationship exists between two quantitative variables.
The research question concerns the rate of change in the response variable.
The goal is to determine whether the population slope differs from a hypothesized value, usually zero.
Assumptions of linear regression (linearity, constant spread, normality of errors, independence) are expected to be checked.
Any situation where researchers analyze how one quantitative variable predicts another is a setting for testing the slope. The regression setting is not appropriate for categorical variables, nonlinear patterns, or descriptive questions lacking inferential intent.
Linking the Testing Method to Statistical Reasoning
Choosing the correct inference method requires understanding the structure of the data and the purpose of the analysis. The t-test for the slope supports claims about population relationships by formally addressing whether observed patterns could reasonably occur under random sampling alone.
Students should interpret the t-test as part of a broader investigative framework:
Describe the relationship using a scatter plot and regression output.
Assume a hypothesized slope under the null model.
Measure how far the observed slope deviates from that assumption.
Use the t-distribution to determine whether such a deviation is plausible.
This alignment of statistical reasoning and method selection is central to proper inference.
Summary of What Students Must Recognize for This Subsubtopic
When the research question concerns whether the population slope β differs from a hypothesized value, the correct procedure is a t-test for the slope.
This method is rooted in the sampling distribution of the slope estimate and its associated standard error.
The t-distribution is required because the model uses sample-based estimates of variability.
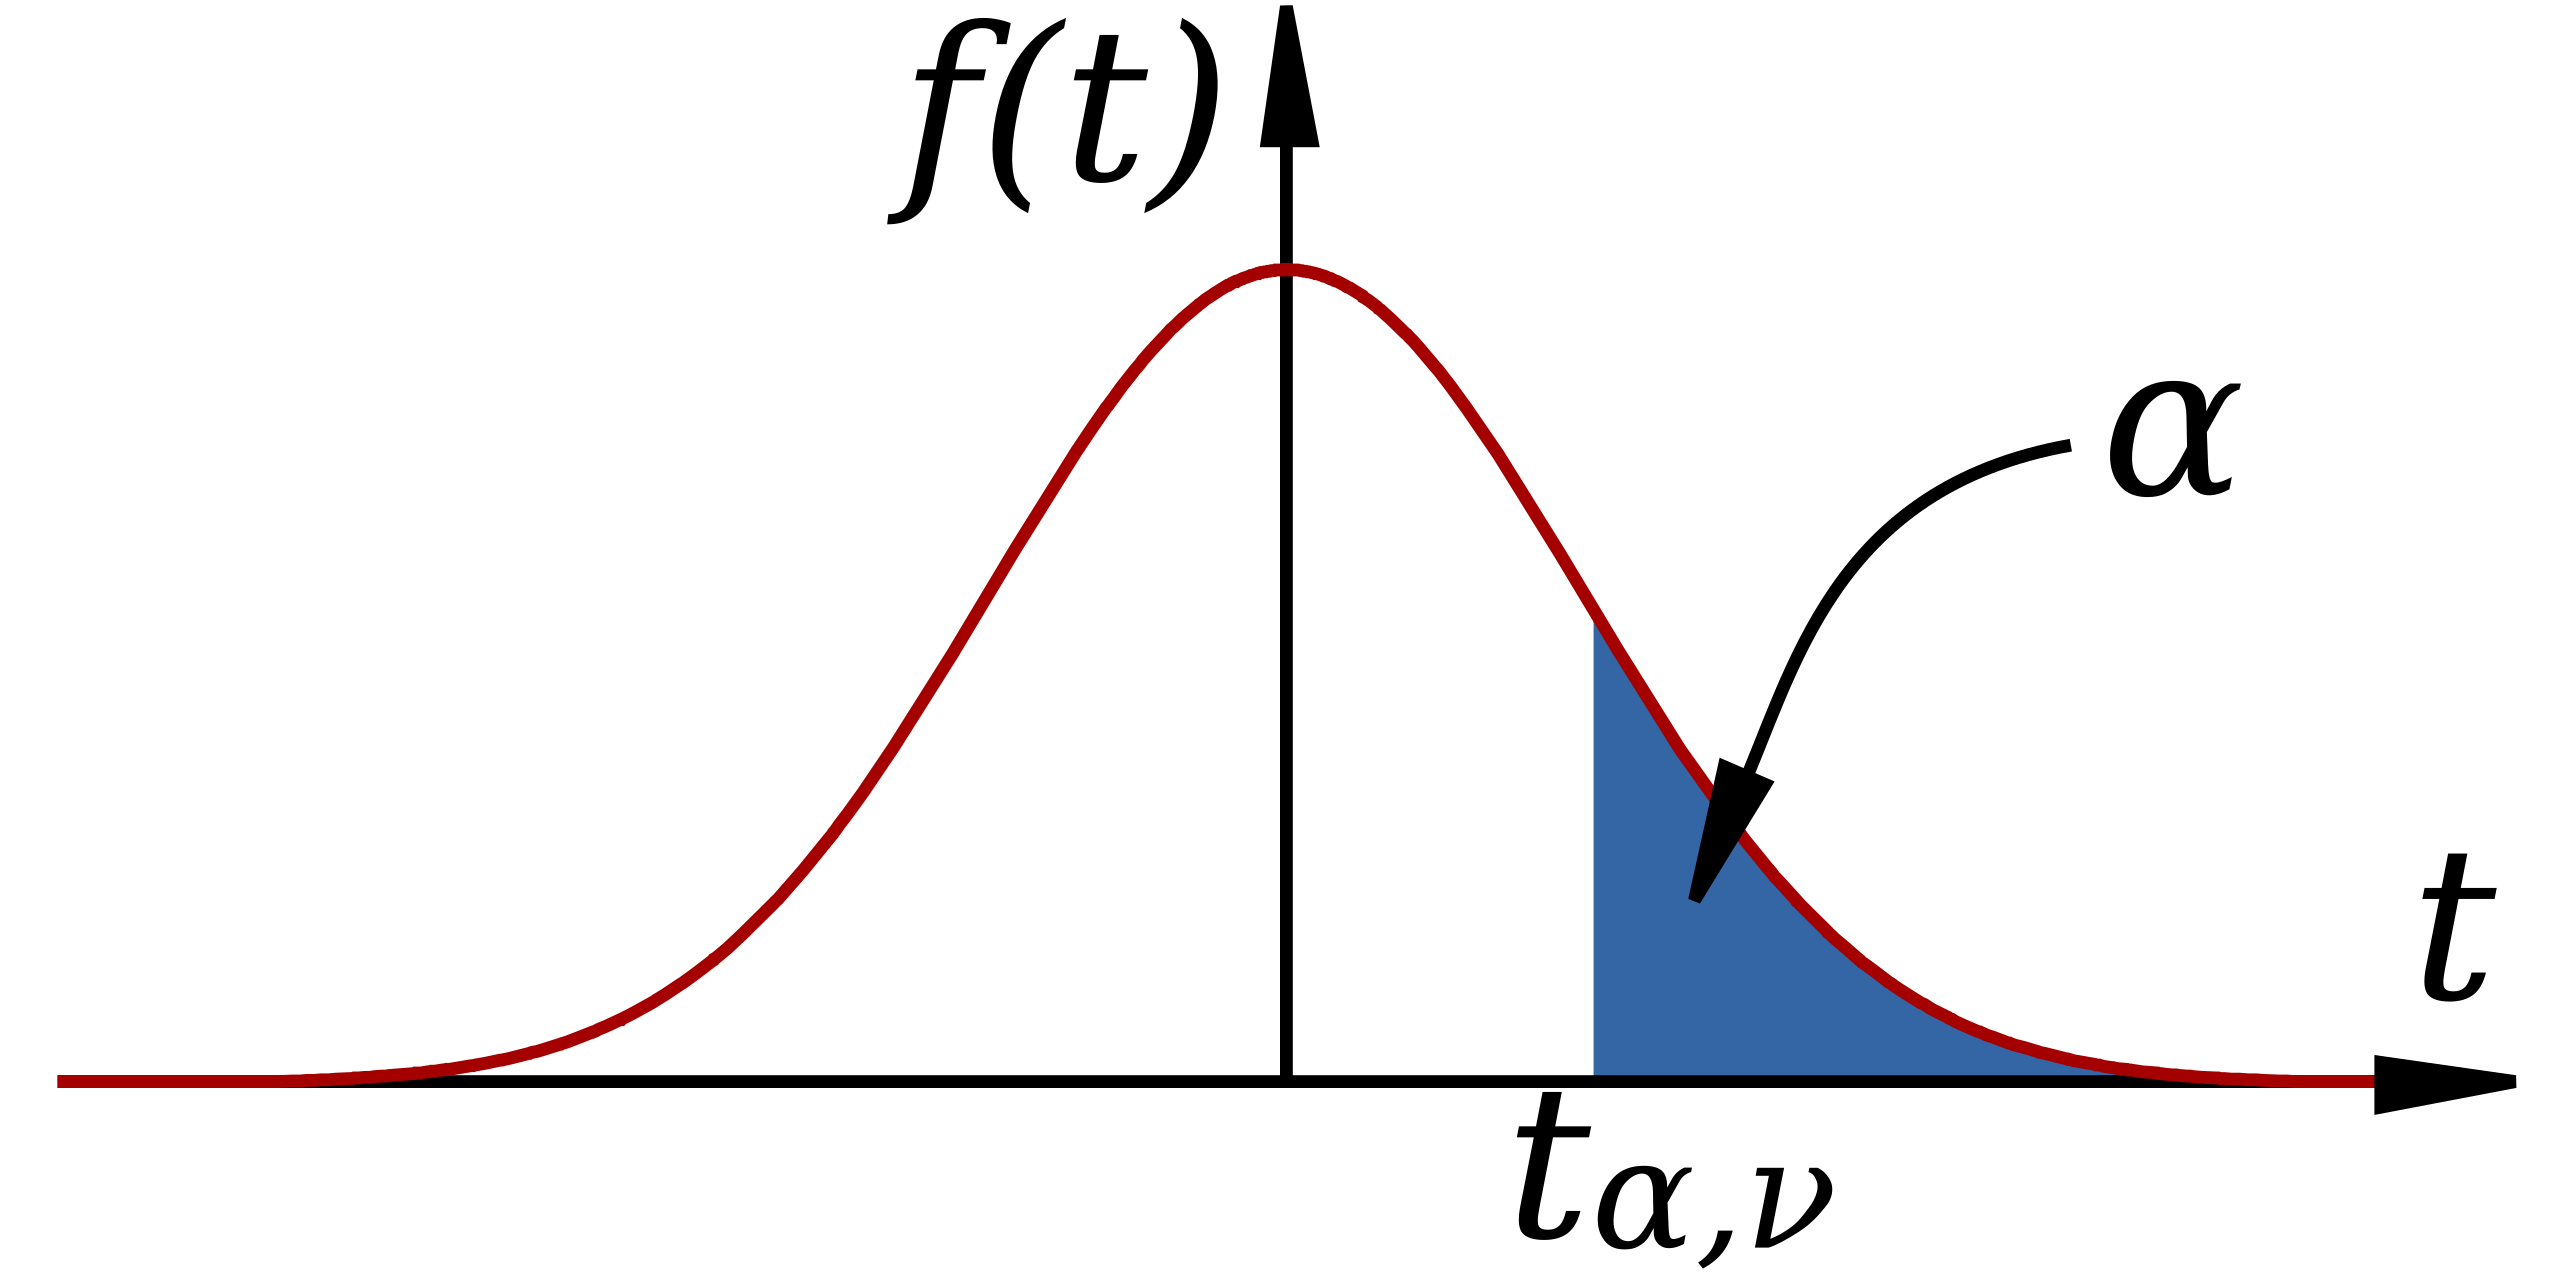
The curve depicts a Student’s t-distribution with a shaded tail region and a labeled critical value tp,νt_{p,\nu}tp,ν. This highlights how t-tests use a cutoff on the t-distribution to determine whether a test statistic for the slope is unusually large in the direction of the alternative hypothesis. The explicit notation for the confidence limit ppp and degrees of freedom ν\nuν adds detail beyond the syllabus but remains consistent with the ideas underlying slope tests. Source.
Understanding the purpose and logic of the test is the main skill at this stage, not computation.
FAQ
A slope test evaluates whether the predicted change in the response variable per unit change in the explanatory variable is non-zero, while a correlation test evaluates the strength of linear association without modelling prediction.
The slope test requires a specified regression model, whereas a correlation test does not assume one variable predicts the other.
A slope test allows directional hypotheses; a correlation test does not.
The goal of slope testing is to determine whether changes in the explanatory variable produce predictable changes in the response variable at the population level.
A strong sample association can still produce a slope that is not statistically significant if variability is high or sample size is small.
Slope testing formalises whether the relationship is likely to persist beyond the sample.
Yes. The intercept does not affect the validity of testing the slope and is often uninterpretable in practice.
The t-test concerns only whether the rate of change between variables differs from the hypothesised value, regardless of whether the intercept lies outside the data range.
Only the slope parameter features in the test's hypotheses and reasoning.
A slope test is more meaningful when the scatter plot shows:
• A roughly linear trend
• No extreme outliers driving the pattern
• A visible change in the response variable across the range of the explanatory variable
If the plot shows no discernible trend, the slope test will almost certainly yield non-significant results and may not be worth pursuing.
A slope may fail to reach significance when:
• The sample size is too small to provide sufficient precision
• Variability in the response variable is high
• The explanatory variable has a restricted range
These conditions inflate the standard error of the slope, making the observed estimate less distinguishable from the hypothesised value.
Practice Questions
Question 1 (1–3 marks)
A researcher is studying whether the amount of fertiliser applied to plants can predict plant height. They collect quantitative data for both variables and want to test whether the population slope differs from zero.
(a) Identify the appropriate statistical test for assessing whether the population slope is different from zero.
(b) Briefly justify why this test is appropriate in this context.
Question 1
(a) 1 mark
• Correctly identifies a t-test for the slope (or test for the regression slope).
(b) 1–2 marks
• States that the t-test is used because the slope estimate is subject to sampling variability and its standard error must be estimated (1 mark).
• Mentions that the test assesses whether the sample provides evidence of a non-zero relationship between two quantitative variables (1 mark).
Total: 2–3 marks
Question 2 (4–6 marks)
A geologist records the depth (in metres) of several rock samples and measures the corresponding pressure readings. They wish to determine whether depth is a significant predictor of pressure in the population.
(a) State the appropriate inference procedure for testing whether the population slope is equal to zero.
(b) Explain how the sampling distribution of the sample slope supports the use of this procedure.
(c) Describe one context-based situation in which this slope test would not be appropriate.
Question 2
(a) 1 mark
• Correctly states that the appropriate inference procedure is a t-test for the regression slope.
(b) 2–3 marks
• Explains that the sample slope is an unbiased estimator of the population slope (1 mark).
• Notes that its variability is measured through the estimated standard error (1 mark).
• States that because variability is estimated rather than known, the test statistic follows a t-distribution (1 mark).
(c) 1–2 marks
• Gives an appropriate scenario in which the test is not suitable, such as:
– Variables are categorical rather than quantitative.
– The relationship is clearly non-linear.
– Regression assumptions (e.g. linearity, independence) are violated.
Award 1 mark for identifying a correct case, and 1 mark for explaining why the slope test would not be appropriate.
Total: 4–6 marks
