
AP Syllabus focus:
‘The p-value measures the probability of observing a test statistic as extreme as, or more extreme than, the calculated value, assuming the null hypothesis is true. This interpretation helps in understanding the strength of evidence against the null hypothesis, particularly regarding the true population slope.’
A significance test for a regression slope relies on understanding the p-value, which indicates how compatible the sample’s observed slope is with the null hypothesis.
Interpreting the p-Value for a Regression Slope
Understanding the Role of the p-Value
When performing a significance test for the slope of a regression model, the p-value quantifies the strength of evidence against the null hypothesis (H₀), which typically states that the population slope β equals some hypothesized value, often zero. Because regression slope inference centers on determining whether a linear relationship exists between two quantitative variables, interpreting the p-value correctly is essential for drawing accurate conclusions.
Definition of the p-Value
The first time the term appears, it requires clarification.
p-value: The probability of obtaining a test statistic as extreme as, or more extreme than, the observed value, assuming the null hypothesis is true.
This probability statement reflects how surprising the sample’s results would be if the null hypothesis accurately described the population relationship.
A p-value is always computed under the assumption that H₀ is true, and therefore it does not measure the probability that the null hypothesis is correct. Rather, it evaluates how consistent the observed sample slope is with a world in which the hypothesized slope is exactly valid.
Connecting the p-Value to the Regression Slope
Interpreting a p-value in the context of regression focuses on the slope estimate, denoted b, and how far this estimate deviates from the hypothesized slope β₀. If the observed slope differs substantially from β₀ relative to its standard error, the resulting test statistic will be large in magnitude, producing a small p-value.
EQUATION
= sample slope
= hypothesized population slope
= standard error of the slope
This equation highlights how slope variability is incorporated into the significance test. A more extreme t-value corresponds to stronger evidence against the null hypothesis and therefore a smaller p-value.
Because regression inference assumes conditions such as linearity, independence, normality of residuals, and constant variability, the meaningfulness of the p-value depends on these conditions being sufficiently met. If assumptions fail, the calculated p-value may no longer represent the intended probability.
What a p-Value Tells Us
A correctly interpreted p-value addresses a precise probability statement:
It gives the likelihood of observing the sample slope or something more extreme, in repeated samples of the same size, if the true population slope equals the hypothesized value.
It does not give the probability that the null hypothesis is true or false.
It does not describe the magnitude or practical significance of the relationship between variables.
A small p-value (typically ≤ α, such as 0.05) indicates that the sample data would be unlikely if the null hypothesis were true, providing evidence for a nonzero slope in the population. Conversely, a large p-value suggests insufficient evidence to conclude that the slope differs from the hypothesized value. The comparison between the p-value and the significance level α formalizes this idea.
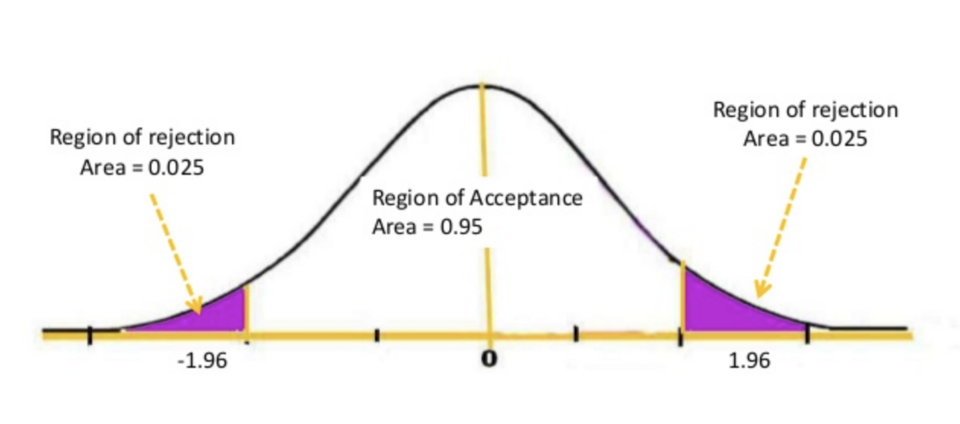
This figure shows a bell-shaped distribution with a central acceptance region and shaded tail regions representing rejection areas. Under the null hypothesis, the test statistic is expected to fall in the central region most frequently, while values in the shaded tails are unusually extreme. The tails visually correspond to very small p-values, which indicate evidence against the null hypothesis and motivate rejecting it when they are at most α; the diagram includes some extra labeling beyond the AP syllabus but reinforces the same concept. Source.
Using the p-Value to Make Inferences
To understand the strength of evidence provided by the p-value, consider how varying magnitudes influence interpretation:
Very small p-value (e.g., < 0.01): Strong statistical evidence that the true slope differs from β₀.
Moderate p-value (e.g., around 0.05): Some evidence against the null hypothesis, though conclusions may depend on context and chosen significance level.
Large p-value (e.g., > 0.10): Little evidence against the null; the observed slope is reasonably plausible under the hypothesized value.
These interpretations align with the AP Statistics emphasis on describing results in context, noting both the sample from which the slope is estimated and the population to which conclusions apply.
Interpreting the p-Value in Context
When interpreting a p-value for a regression slope, students should incorporate these elements:
Identify the slope being tested and specify the null hypothesis.
State the p-value as a probability under the assumption that the null hypothesis is true.
Clarify whether the observed relationship provides convincing evidence of a nonzero population slope.
Connect the conclusion explicitly to the variables under study.
For example, statements should reference the relationship between the explanatory and response variables and the population parameters they represent. A context-based interpretation highlights that the p-value quantifies uncertainty in the slope estimate rather than certainty about real-world effects.
In the context of regression, a significance test for the slope asks whether the observed relationship between x and y in the sample is strong enough, relative to random variation, to conclude that there is a genuine linear association in the population.
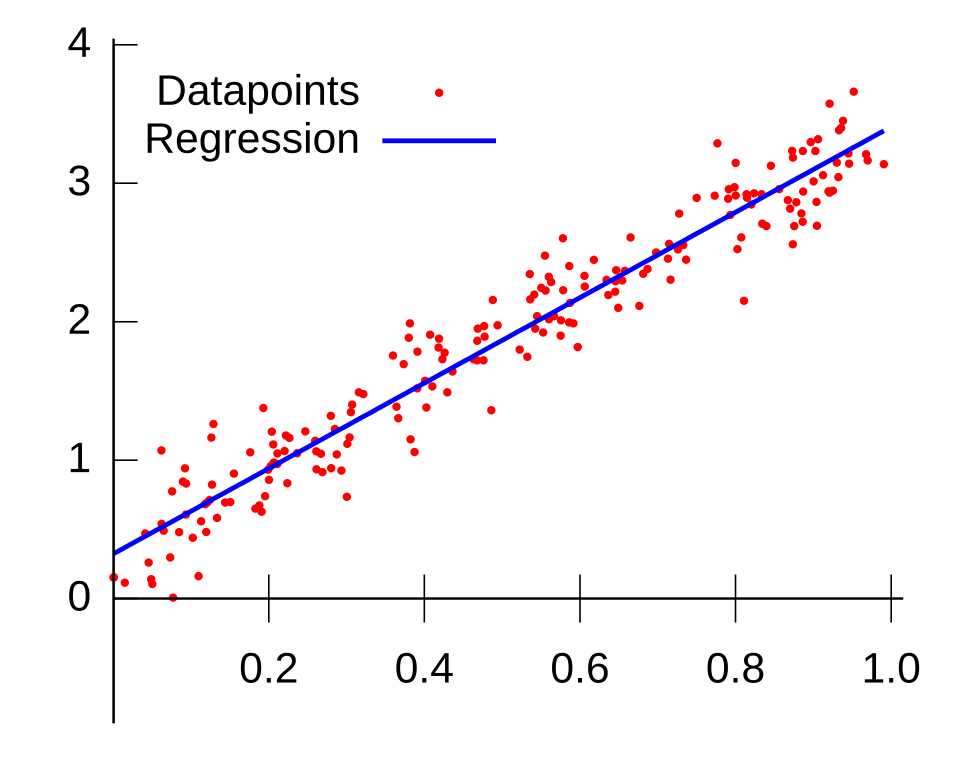
This figure shows a scatterplot of data points with a fitted least-squares regression line. The slope of the line summarizes the direction and strength of the linear relationship between the variables. In significance testing for the slope, the p-value indicates how unusual a slope at least this extreme would be if, in reality, there were no true linear relationship in the population. Source.
Why the p-Value Matters in Regression Analysis
The interpretation of the p-value forms the foundation for justifying conclusions in slope significance testing. Because regression seeks to generalize from sample patterns to population relationships, the p-value provides a standardized mechanism for evaluating whether observed trends likely reflect true underlying associations.
FAQ
A one-sided test places all tail probability in the direction specified by the alternative, which typically results in a smaller p-value if the sample slope aligns with that direction.
A two-sided test splits tail probability across both ends of the distribution, so the p-value is generally larger because it accounts for extremeness in both directions.
Choosing between the two must be justified by the research question, not by whichever gives stronger evidence.
The p-value reflects how extreme the observed slope is relative to expected random variation. Even a large slope can yield a high p-value if the data are noisy.
Key contributors include:
• The spread of points around the regression line.
• The sample size, which affects slope precision.
• The standard error of the slope, which scales the test statistic.
Yes. A weak relationship can still yield a small p-value when the sample size is large enough.
This happens because large samples produce very precise slope estimates, making even small deviations from zero statistically detectable.
A small p-value does not guarantee real-world importance and must be considered alongside the effect size.
Scatterplots can reveal patterns that violate regression assumptions.
Potential warning signs include:
• Curvature, implying the relationship is not truly linear.
• Clusters or subgroups that distort the slope.
• Outliers or influential points that heavily affect the regression line.
In such cases, the p-value may understate the uncertainty in the slope.
Influential points can dramatically change both the slope estimate and its standard error.
Removing such a point may:
• Reduce the magnitude of the slope, making the p-value larger.
• Reduce variability, making the p-value smaller.
• Change the direction of the slope entirely in extreme cases.
This sensitivity underscores the importance of checking residuals and leverage diagnostics before interpreting p-values.
Practice Questions
Question 1 (1–3 marks)
A researcher tests whether the slope of a regression line relating study hours (x) to exam score (y) differs from zero. The resulting p-value is 0.018 when tested at the 5% significance level.
(a) Interpret this p-value in context.
(b) State whether the researcher should reject the null hypothesis and justify your decision.
Question 1
(a) 1–2 marks
• 1 mark: States that the p-value represents the probability of obtaining a slope estimate as extreme as the one observed assuming the true slope is zero.
• 1 additional mark: Provides context by referencing study hours and exam score.
(b) 1 mark
• Rejects the null hypothesis because 0.018 is less than 0.05, indicating evidence that the slope differs from zero.
Total: 3 marks
Question 2 (4–6 marks)
A biologist studies whether the concentration of a nutrient in soil (x) predicts the growth rate of a plant species (y). A significance test for the slope produces a test statistic of t = 2.41 with a p-value of 0.024. The hypotheses are:
H0: The population slope is 0
Ha: The population slope is greater than 0
(a) Explain what the p-value of 0.024 means in the context of this study.
(b) Using a significance level of 0.05, determine whether there is evidence of a positive linear association between soil nutrient concentration and plant growth rate.
(c) Briefly explain why a small p-value provides evidence against the null hypothesis when testing a regression slope.
Question 2
(a) 1–2 marks
• 1 mark: States that the p-value is the probability of obtaining a test statistic at least as extreme as 2.41 if the true slope is actually zero.
• 1 additional mark: Includes context by referring to soil nutrient concentration and plant growth rate.
(b) 1–2 marks
• 1 mark: States that the biologist should reject the null hypothesis because 0.024 < 0.05.
• 1 mark: Correctly concludes that there is evidence of a positive linear association in the population.
(c) 1–2 marks
• 1 mark: Explains that a small p-value indicates the sample data would be unlikely if the null hypothesis were true.
• 1 mark: Connects this to increased evidence that the true slope is not zero (i.e., the alternative hypothesis is more consistent with the observed data).
Total: 6 marks
