
AP Syllabus focus:
‘Learning Objective: Justify a claim about the population based on the results of a significance test for the slope of a regression model. Essential Knowledge: Decisions are made by comparing the p-value to a predetermined significance level (α). If the p-value ≤ α, reject the null hypothesis, indicating evidence for a non-zero slope in the population. If the p-value > α, fail to reject the null hypothesis, indicating insufficient evidence to conclude a non-zero slope. This process forms the basis of statistical reasoning in support of research questions related to the slope of the regression model.’
Interpreting significance test results for a regression slope requires understanding how the p-value, significance level, and hypotheses interact to justify claims about population relationships.
Understanding Decisions in Slope Significance Testing
When evaluating a regression slope, the goal is to determine whether the sample provides convincing evidence that the population slope β differs from the value stated in the null hypothesis. A significance test connects sample outcomes to population-level claims by quantifying how surprising the observed slope would be if the null hypothesis were true.
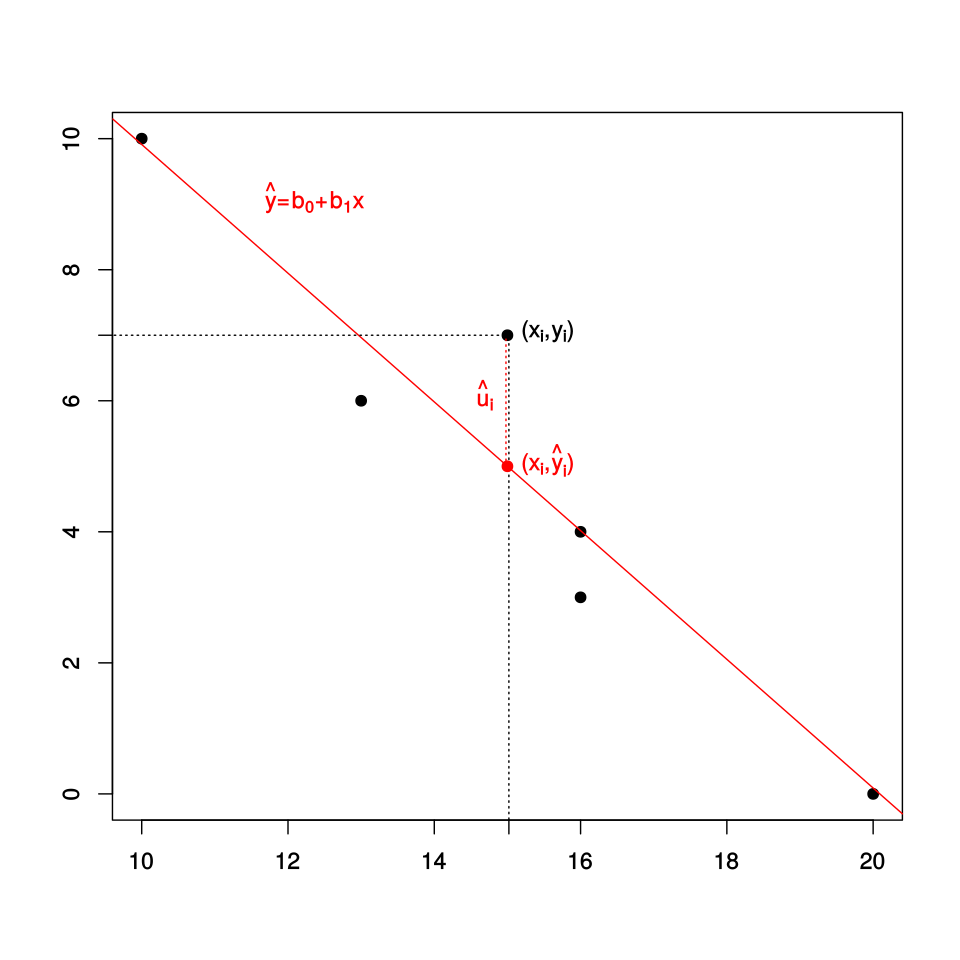
Scatterplot with fitted regression line illustrating the sample slope and one observation’s residual, emphasizing that slope reflects the overall linear trend rather than any single point. Source.
The Role of the Null and Alternative Hypotheses
The null hypothesis, denoted H₀, asserts that the true population slope equals a specific value, often β = 0, meaning no linear relationship exists between the variables. The alternative hypothesis, denoted Hₐ, specifies the type of relationship the analyst seeks evidence for, whether β ≠ 0, β > 0, or β < 0. These hypotheses guide interpretation once the p-value has been computed.
Null Hypothesis (H₀): A statement asserting no effect or no difference; in slope testing, it posits that the population slope β equals a hypothesized value β₀.
A clear understanding of these hypotheses is essential because any justified claim must reference which hypothesis is supported by the test results in context.
Interpreting the p-Value in Context
The p-value measures the probability of obtaining a test statistic as extreme as, or more extreme than, the observed one if the null hypothesis is true. Thus, it expresses how compatible the data are with the assumption that the population slope is equal to β₀. A very small p-value suggests that the observed slope would be unlikely if the null hypothesis were correct, providing evidence in favor of the alternative hypothesis.
p-Value: The probability, assuming the null hypothesis is true, of obtaining a test statistic as extreme as or more extreme than the observed value.
Because the p-value is central to decision making, it must always be interpreted in the context of the research question and the population represented by the sample.
Using the Significance Level (α) to Make Decisions
A significance level, α, establishes the threshold for determining whether the p-value is small enough to reject the null hypothesis. Typical choices include 0.05 or 0.01, depending on how stringent the decision criteria need to be. This threshold represents the maximum acceptable probability of incorrectly rejecting a true null hypothesis.
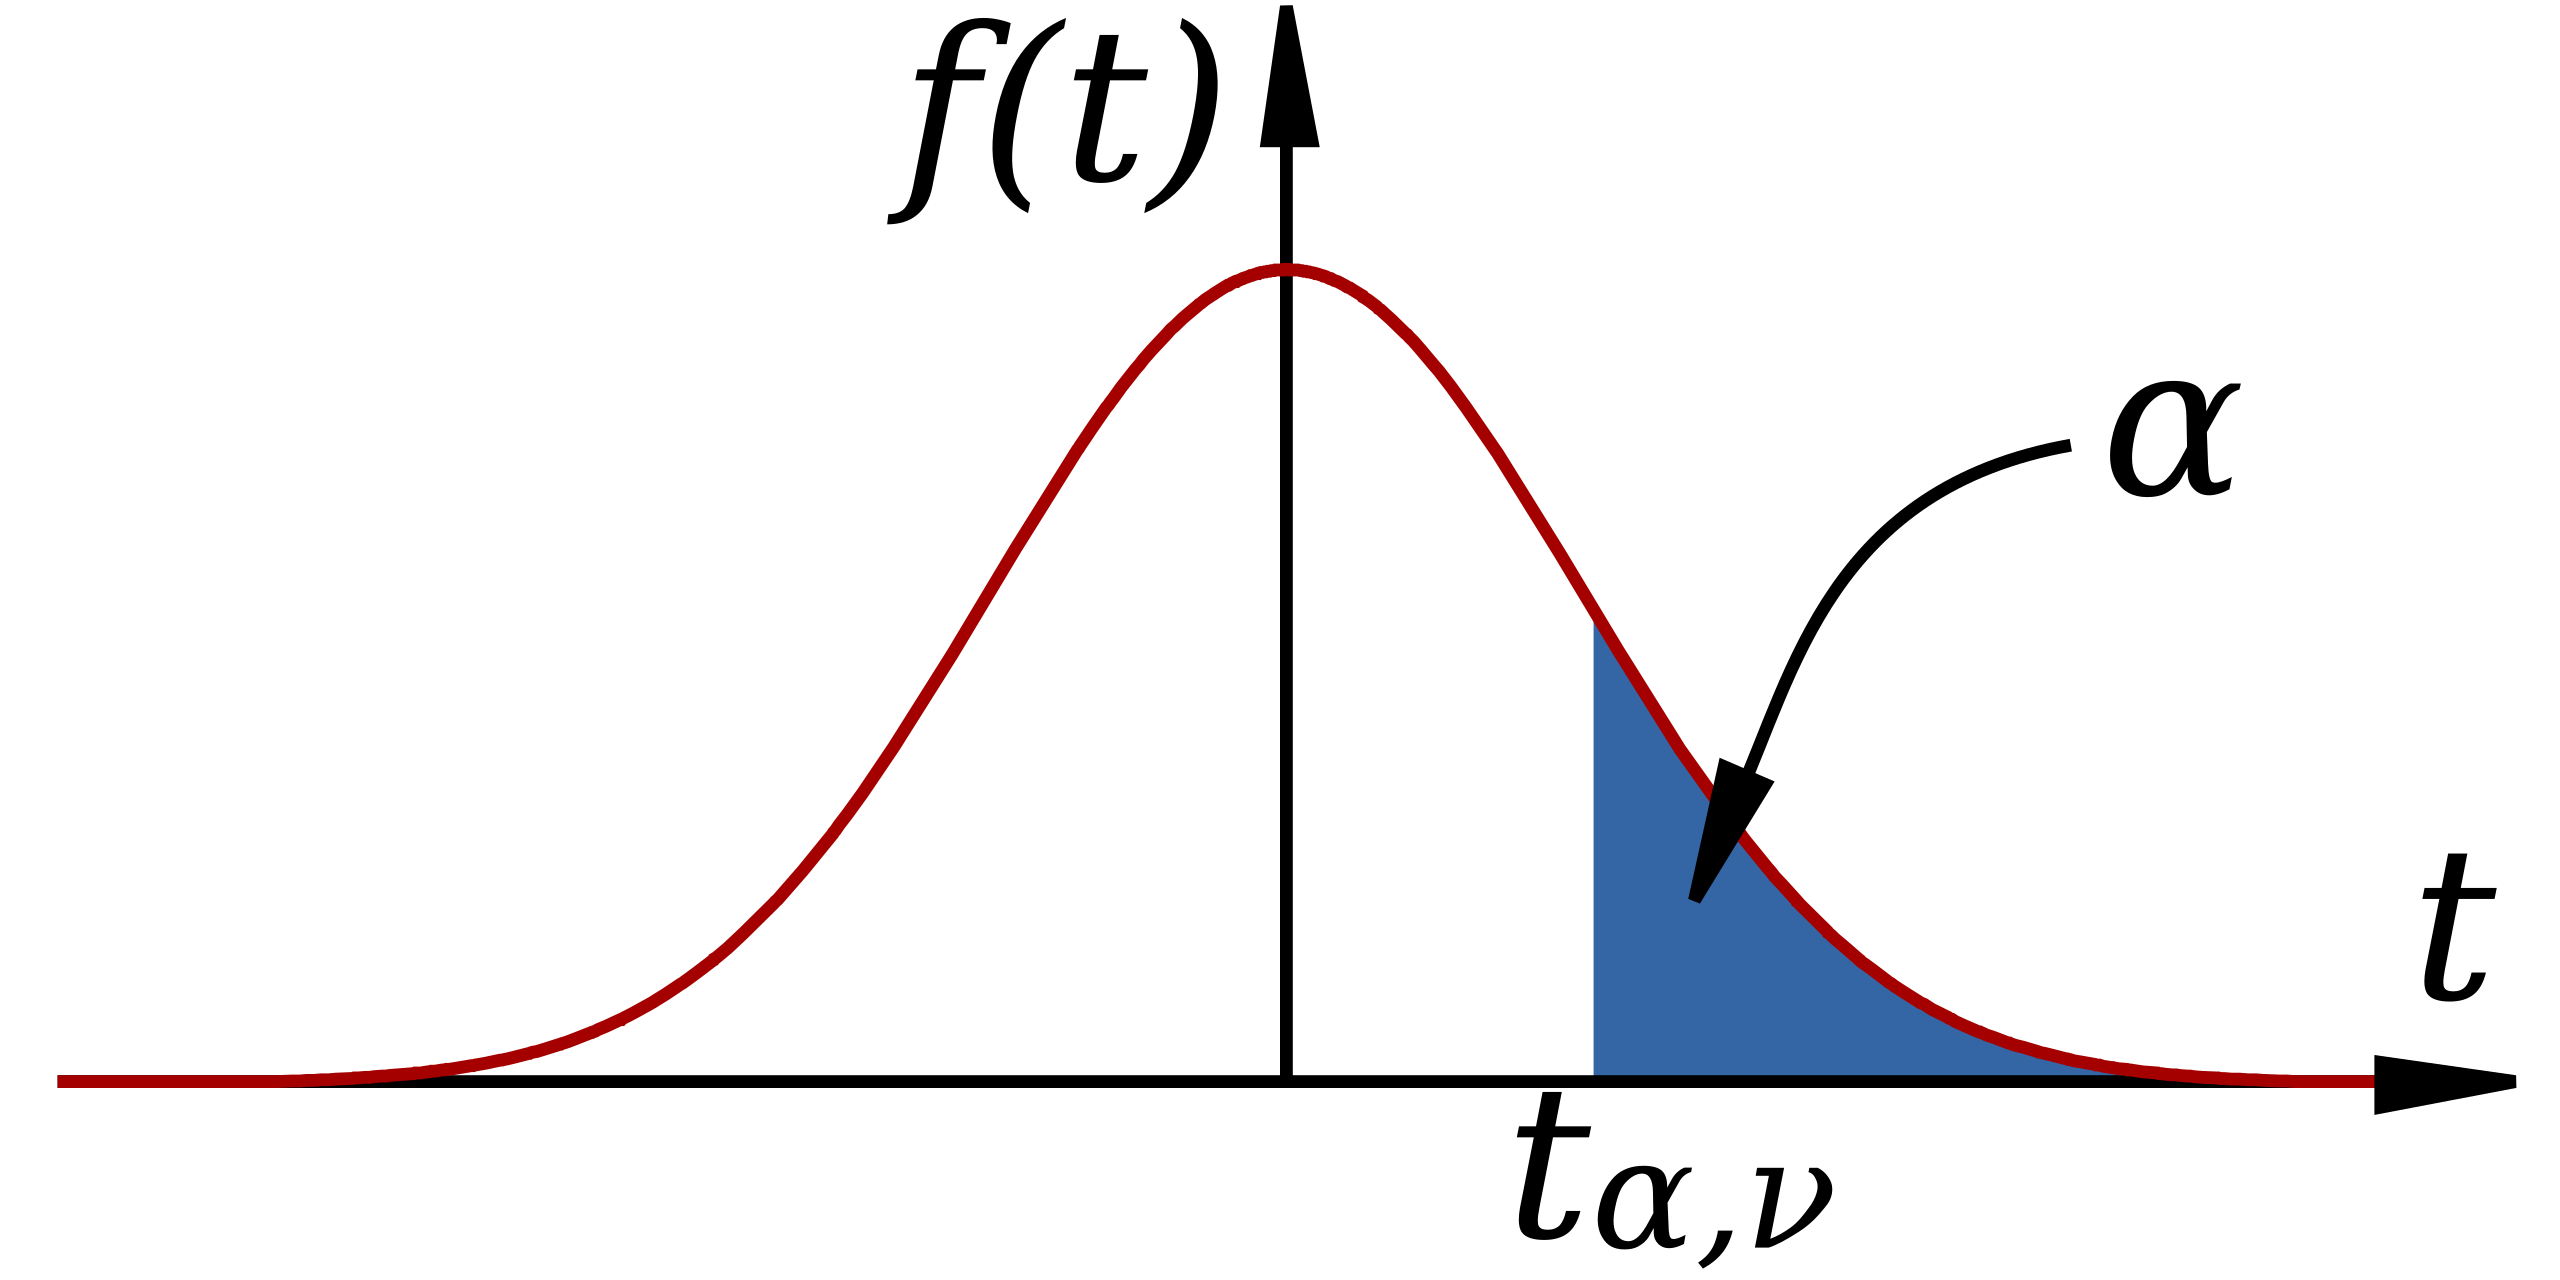
Student t-distribution curve with shaded rejection region, illustrating how α corresponds to a tail probability beyond a critical value when testing a regression slope. Source.
Once both α and the p-value are known, the decision rule follows directly:
• If p-value ≤ α, reject H₀.
• If p-value > α, fail to reject H₀.
These outcomes frame how evidence is communicated in statistical claims.
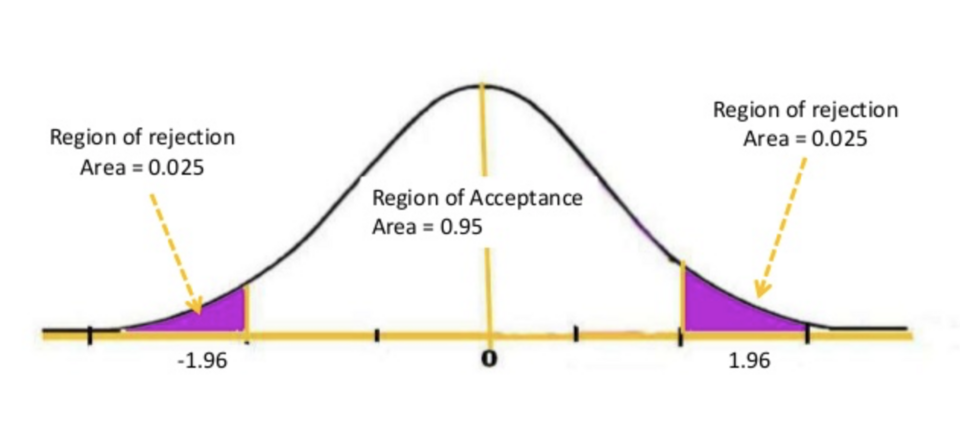
Normal distribution curve showing acceptance and rejection regions, reinforcing how extreme test statistics fall in tail areas where the null hypothesis is rejected. Source.
Justifying a Claim Based on Test Results
A justified claim must explicitly connect the decision from the p-value–α comparison to the population slope. The justification should reflect three core components:
• Reference to the hypotheses being evaluated
• Explanation of how the p-value compares to α
• Interpretation of what the outcome implies about the population slope β
When p-value ≤ α, the data provide evidence of a non-zero slope, meaning a linear relationship likely exists in the population. Conversely, when p-value > α, the data do not provide strong enough evidence to conclude that the population slope differs from β₀. Importantly, failing to reject H₀ does not prove that the slope is zero; it only indicates insufficient evidence to assert otherwise.
A properly justified claim always links back to the research context. For example, if a test aims to determine whether hours studied predict exam scores, a rejection of H₀ supports the claim that studying has a statistically significant linear effect on performance. The justification must state that the conclusion applies to the population, not merely the sample.
Communicating Statistical Evidence
Strong justification relies on precise language that reflects statistical reasoning. Claims should:
• State whether the null hypothesis is rejected or not
• Describe the evidence level (strong, moderate, weak) when appropriate
• Make population-level statements rather than sample-level statements
• Avoid causal language unless the study design is experimental
These communication principles ensure that justified claims accurately reflect what the significance test is capable of confirming.
Overall, justifying a claim based on test results involves interpreting the p-value relative to α and explaining what that decision implies about the population slope. This reasoning forms a key part of inference in regression analysis and supports meaningful conclusions about relationships between quantitative variables.
FAQ
A frequent misunderstanding is assuming that a large p-value proves the null hypothesis is true. In reality, it only indicates that the sample data do not provide strong enough evidence against it.
Another misconception is believing that the p-value measures the probability that the null hypothesis is correct. Instead, it measures how unusual the observed data would be if the null hypothesis were assumed true.
Context should connect the statistical conclusion back to the variables and population being studied. A justification must clearly state the practical meaning of a non-zero or zero slope in that specific scenario.
A good justification refers to:
• The population represented by the sample
• The direction of the relationship implied by the sample slope
• The real-world interpretation of whether evidence supports or fails to support a linear association
Failing to reject often occurs when the sample size is small or the true slope is weak, making the test less sensitive to detecting a real effect.
It means the evidence is insufficient, not contradictory. The true slope may still be non-zero, but the data do not provide strong enough support to confirm this.
The significance test focuses on evidence of a non-zero slope, but the magnitude helps determine how meaningful the relationship is in practice.
A very small slope may be statistically significant with a large sample but have limited real-world importance. Conversely, a large slope that is not statistically significant may suggest a potentially meaningful association that requires more data to verify.
Effective justifications often include:
• Evidence wording: “based on the p-value relative to the significance level”
• Population statements: “in the population”
• Clear decisions: “reject” or “fail to reject the null hypothesis”
• Relationship language: “evidence of a linear association” or “insufficient evidence of a non-zero slope”
Avoid causal language unless an experiment was performed.
Practice Questions
A researcher tests whether the slope of a regression line between students’ revision hours and exam scores differs from zero. The test yields a p-value of 0.18 with a significance level of 0.05. Based on these results, what claim can the researcher make about the population slope? (1–3 marks)
• States that the researcher fails to reject the null hypothesis because the p-value (0.18) exceeds 0.05. (1 mark)
• States that there is insufficient evidence to conclude that the population slope differs from zero. (1 mark)
• States that no claim of a linear relationship in the population can be justified based on this test. (1 mark)
A study investigates whether daily screen time predicts levels of reported stress. A regression analysis is conducted, and a significance test for the slope is performed with the following results:
• Estimated slope: 0.42
• Hypothesised slope under the null: 0
• Standard error of slope: 0.15
• p-value: 0.012
• Significance level: 0.05
Using this information, answer the following:
(a) State the null and alternative hypotheses for the test.
(b) Justify whether the result provides evidence of a non-zero population slope.
(c) Explain what the conclusion implies about the relationship between screen time and stress in the population.
(4–6 marks)
(a)
• Correct null hypothesis: the population slope equals zero. (1 mark)
• Correct alternative hypothesis: the population slope is not equal to zero or is greater/less than zero depending on candidate’s stated direction. (1 mark)
(b)
• Recognises that the p-value (0.012) is less than 0.05. (1 mark)
• Concludes that the null hypothesis is rejected. (1 mark)
(c)
• States that the data provide evidence of a non-zero population slope. (1 mark)
• Explains that this suggests screen time is linearly associated with stress levels in the population, in the direction indicated by the sample slope. (1 mark)
