
AQA Specification focus:
‘Utility theory: total and marginal utility, and the hypothesis of diminishing marginal utility; students should appreciate that the hypothesis of diminishing marginal utility supports a downward sloping demand curve (they are not expected to understand the principle of equi-marginal utility).’
Utility theory explains how consumers derive satisfaction from goods and services and how this influences demand, with diminishing marginal utility shaping the downward slope of the demand curve.
Understanding Utility Theory
Utility refers to the satisfaction or pleasure that an individual gains from consuming a good or service. It is a central concept in microeconomics, helping to explain consumer choices and market demand. Utility can be measured in hypothetical units called utils, although in practice it is treated ordinally rather than cardinally.
Total Utility (TU): The total satisfaction derived from consuming a certain quantity of a good or service.
Marginal Utility (MU): The additional satisfaction gained from consuming one extra unit of a good or service.
While total utility typically increases as more is consumed, marginal utility usually decreases with each additional unit — this is known as the hypothesis of diminishing marginal utility.
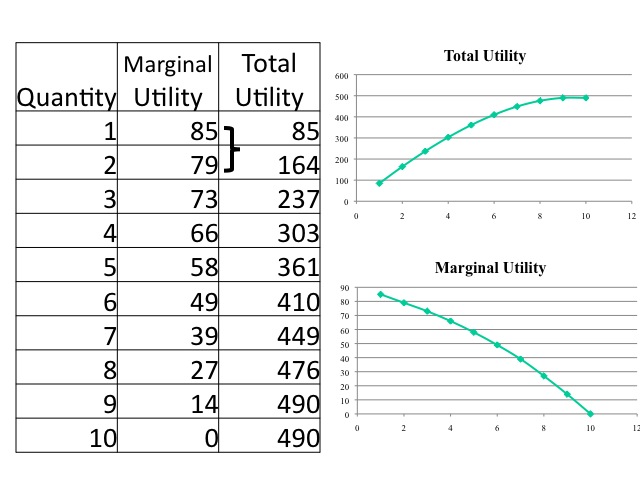
The graph depicts the relationship between total utility and marginal utility. As consumption increases, total utility rises at a decreasing rate, and marginal utility declines, illustrating the principle of diminishing marginal utility. Source
The Hypothesis of Diminishing Marginal Utility
The hypothesis of diminishing marginal utility states that as a person consumes more units of a good over a given time period, the additional satisfaction from each extra unit tends to decline. For example, the first slice of pizza brings high satisfaction, but by the fourth or fifth, the added enjoyment is much lower.
This concept underpins the downward-sloping demand curve:
Consumers are only willing to purchase additional units if the price decreases, compensating for the lower marginal utility of each extra unit.
This relationship between marginal utility and price helps explain why demand curves slope downwards from left to right.
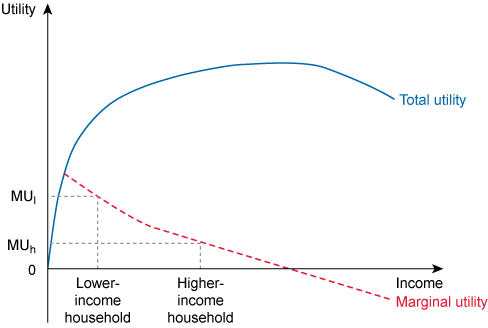
The graph shows the relationship between utility and income. Total utility increases rapidly at low income levels but at a decreasing rate as income rises, eventually plateauing, reflecting the diminishing marginal utility of income. Source
Total and Marginal Utility Relationship
Total Utility (TU) increases at a decreasing rate when marginal utility is positive but falling.
Marginal Utility (MU) is the change in total utility when one more unit is consumed.
When marginal utility becomes zero, total utility is maximised.
If marginal utility becomes negative, total utility will start to fall, indicating overconsumption.
Marginal Utility (MU) = Change in Total Utility (ΔTU) ÷ Change in Quantity Consumed (ΔQ)
MU = Extra satisfaction gained from consuming one more unit
TU = Sum of satisfaction from all units consumed
Q = Number of units consumed
Importance for Economic Decision Making
In standard microeconomic theory, rational consumers aim to maximise total utility given their budget constraints. Diminishing marginal utility explains why consumers spread spending across different goods rather than purchasing unlimited quantities of one item.
Key implications include:
Consumers allocate spending to equalise the marginal utility per unit of currency spent across goods (although AQA does not require the principle of equi-marginal utility).
Prices influence consumption by altering the marginal utility per pound.
Linking Marginal Utility to Demand
The link between marginal utility and demand is essential for understanding market behaviour:
High marginal utility → willingness to pay a higher price.
Low marginal utility → purchase only at a lower price.
Aggregating across all consumers generates a market demand curve that slopes downward.
Assumptions Underpinning Utility Theory
Utility theory operates under several assumptions that make analysis tractable:
Rationality: Consumers act to maximise utility.
Diminishing marginal utility: Satisfaction from additional units decreases.
Stable preferences: Consumer tastes remain constant during analysis.
Perfect information: Consumers know prices and product qualities.
These assumptions help explain behaviour in theory, although in practice behavioural economics highlights deviations such as bias and bounded rationality.
Graphical Representation
In a typical utility diagram:
The total utility curve rises at a decreasing rate.
The marginal utility curve slopes downwards, intersecting the x-axis where total utility is maximised.
The point where marginal utility equals price indicates the consumer’s equilibrium quantity demanded.
Applications in Real Markets
Understanding diminishing marginal utility has practical applications:
Pricing strategies: Firms may use bulk discounts to encourage purchase of additional units despite lower marginal utility.
Indirect taxation: Governments tax goods like alcohol and tobacco where diminishing marginal utility limits excessive consumption.
Subsidies: Encouraging consumption of goods with high social benefit but potentially low marginal utility, such as vaccinations.
Limitations of Utility Theory
While utility theory is fundamental to economics, it faces limitations:
Utility is subjective and not directly measurable.
Assumes consumers have consistent, well-defined preferences.
Ignores emotional, social, and behavioural factors influencing choices.
Nonetheless, the hypothesis of diminishing marginal utility remains a powerful explanation for why demand curves slope downwards and how consumers allocate resources.
Practice Questions
Define marginal utility and explain how it changes as more units of a good are consumed. (2 marks)
1 mark: Correct definition of marginal utility (additional satisfaction gained from consuming one more unit of a good or service).
1 mark: Clear explanation that marginal utility typically decreases with each additional unit consumed (diminishing marginal utility).
Using a diagram, explain how the hypothesis of diminishing marginal utility helps to explain the downward slope of the demand curve. (6 marks)
1 mark: Correctly drawn diagram showing downward-sloping demand curve.
1 mark: Diagram includes appropriate labelling (axes, curve, and quantities/pices).
1 mark: Reference to marginal utility decreasing as more units are consumed.
1 mark: Explanation that lower marginal utility reduces willingness to pay for additional units.
1 mark: Link between marginal utility and price, stating that price must fall for consumers to buy more.
1 mark: Explicit link between this process and the overall downward slope of the demand curve.
FAQ
As consumers repeatedly purchase a good, the additional satisfaction they gain from each unit falls, leading them to diversify spending towards other goods.
This prevents overconsumption of a single product and encourages a balanced consumption basket. Retailers may counteract this by introducing variety, bundling products, or offering discounts to sustain interest.
Utility is subjective and varies from person to person, making it impossible to assign an exact numerical value.
Economists use ordinal rankings instead, assessing preferences by comparing choices rather than calculating precise satisfaction levels. This avoids the impracticality of measuring “utils” while still capturing consumer behaviour.
Progressive taxation is partly justified by the idea that an extra unit of income provides less utility to a high-income earner than to a low-income earner.
By taxing higher incomes at higher rates, governments can redistribute resources without causing a proportionally large loss of utility for wealthier individuals.
Yes, it applies to intangible consumption such as leisure activities, music, or travel.
For example, the first visit to a landmark may bring high enjoyment, but repeated visits usually produce less additional satisfaction. The same principle affects decision-making beyond physical goods.
Increased variety within the product (different flavours or styles)
Time gaps between consumption, allowing satisfaction to reset
Complementary goods that enhance the experience of the original product
These factors can sustain higher marginal utility for longer, influencing both consumer demand and marketing strategies.
