
AQA Specification focus:
‘How the interaction of demand and supply determines equilibrium prices in a market economy; the difference between equilibrium and disequilibrium; why excess demand and excess supply lead to changes in price; students should be able to use demand and supply diagrams to analyse causes of changes in equilibrium market prices.’
Introduction
Market equilibrium explains how demand and supply interact to set prices. Disequilibrium highlights imbalances where demand and supply mismatch, leading to price adjustments restoring balance.
Market Equilibrium
Market equilibrium occurs when the quantity demanded equals the quantity supplied at a particular price. At this point, there is no tendency for price to change, as both consumers and producers are satisfied with the transaction level.
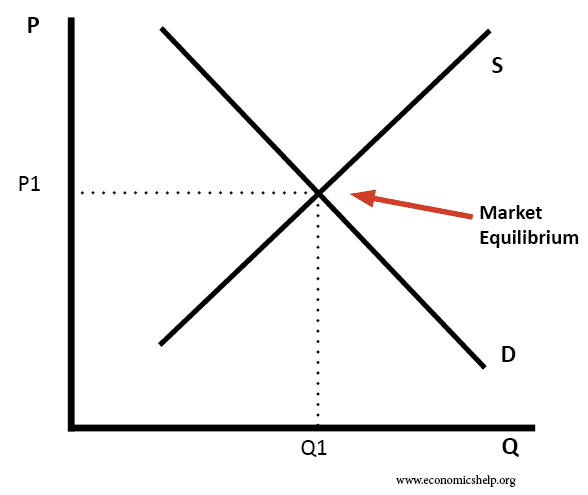
This diagram illustrates the market equilibrium, where the supply and demand curves intersect, indicating the equilibrium price and quantity. The area between the curves represents the equilibrium quantity, and the point of intersection denotes the equilibrium price. Source
Market Equilibrium: The price and output level at which quantity demanded equals quantity supplied, ensuring no excess demand or supply.
Determined by the interaction of demand and supply.
Represented on a diagram where the demand curve (downward sloping) intersects the supply curve (upward sloping).
The point of intersection gives the equilibrium price (also called the market-clearing price) and the equilibrium quantity.
Disequilibrium
Disequilibrium refers to any situation where the market price is not at the level where demand equals supply.
Disequilibrium: A state where the quantity demanded and quantity supplied are not equal, causing pressure for the price to adjust.
Two common forms of disequilibrium occur:
Excess Demand (Shortage): When demand exceeds supply at the current price.
Excess Supply (Surplus): When supply exceeds demand at the current price.
Both situations cause price signals and market forces to push the price back towards equilibrium.
The diagram depicts disequilibrium situations: excess demand occurs when the price is below equilibrium, leading to a shortage, while excess supply arises when the price is above equilibrium, resulting in a surplus. These imbalances create pressure for price adjustments back to equilibrium. Source
Excess Demand and Price Adjustment
When excess demand occurs, the market experiences a shortage.
At prices below equilibrium, quantity demanded > quantity supplied.
Consumers compete to purchase limited goods.
Sellers can increase prices without losing sales, raising profitability.
Higher prices reduce demand (movement along the demand curve) and incentivise more supply (movement along the supply curve).
The process continues until equilibrium is restored.
This dynamic highlights how shortages push prices upwards.
Excess Supply and Price Adjustment
When excess supply occurs, the market faces a surplus.
At prices above equilibrium, quantity supplied > quantity demanded.
Unsold stocks accumulate for firms.
Producers reduce prices to attract buyers and clear excess supply.
Falling prices encourage more demand and discourage some supply.
The downward pressure continues until equilibrium is re-established.
This shows how surpluses drive prices downwards.
The Price Adjustment Process
The price mechanism ensures that disequilibrium does not persist in competitive markets. Price movements serve as signals and incentives to buyers and sellers.
If demand increases:
Demand curve shifts right.
At the original price, excess demand arises.
Prices rise until a new higher equilibrium is reached.
If supply increases:
Supply curve shifts right.
At the original price, excess supply emerges.
Prices fall until a new lower equilibrium is achieved.
Price adjustment is therefore central to resource allocation in a market economy.
Assumptions Underlying Equilibrium Models
Equilibrium analysis is based on simplified assumptions:
Perfect competition: Many buyers and sellers, none able to influence price individually.
Perfect information: Consumers and producers are fully aware of prices and products.
No government intervention: Markets adjust freely without price controls or subsidies.
Ceteris paribus: Other factors remain constant when analysing demand or supply shifts.
These assumptions may not hold in real-world markets, but they provide a foundation for understanding equilibrium and price adjustment.
Interpretation Using Diagrams
Students should use demand and supply diagrams to demonstrate:
The equilibrium point at intersection.
The areas of excess demand (below equilibrium price) and excess supply (above equilibrium price).
How shifts in demand or supply change equilibrium price and output.
Diagrams clarify how equilibrium is dynamic, changing with underlying market conditions.
Key Takeaways
Equilibrium ensures balance, with no tendency for price change.
Disequilibrium occurs when prices are too high (surplus) or too low (shortage).
Price adjustments correct imbalances through the price mechanism.
Diagrams are essential tools for showing equilibrium, disequilibrium, and adjustments.
Practice Questions
Define the term market equilibrium and state what occurs when a market is in equilibrium. (2 marks)
1 mark for correct definition: Market equilibrium is the point where quantity demanded equals quantity supplied.
1 mark for explanation: At equilibrium, there is no excess demand or excess supply, so there is no tendency for price to change.
Using a demand and supply diagram, explain how excess supply leads to price adjustment in a competitive market. (6 marks)
1 mark for correctly identifying excess supply (surplus) occurs when price is above equilibrium.
1 mark for noting that at this price, quantity supplied is greater than quantity demanded.
1 mark for explaining that firms face unsold stock/surplus.
1 mark for describing how firms lower prices to attract buyers.
1 mark for showing that lower prices reduce supply (movement along supply curve) and increase demand (movement along demand curve).
1 mark for final outcome: Price continues to fall until equilibrium is restored where demand equals supply.
FAQ
Equilibrium price shifts when either demand or supply changes. For example, changes in consumer incomes, tastes, or the prices of related goods affect demand.
On the supply side, changes in production costs, technology, or government policies influence how much firms are willing to produce. These shifts create new intersections of demand and supply curves, establishing a new equilibrium price and quantity.
In competitive markets, disequilibrium creates imbalances that naturally trigger corrective forces.
If there is a shortage, buyers compete, pushing prices up.
If there is a surplus, sellers reduce prices to clear stock.
Because these forces quickly move prices towards equilibrium, disequilibrium is inherently unstable and temporary.
No, a single market can only have one equilibrium price at a given time, where demand equals supply.
However, if market conditions change — such as a shift in demand or supply — a new equilibrium will be established at a different price and quantity. Over time, markets may move between several equilibrium points.
Government interventions like price ceilings or price floors prevent prices from moving freely towards equilibrium.
A price ceiling set below equilibrium leads to persistent shortages.
A price floor above equilibrium results in constant surpluses.
These distortions stop the price mechanism from eliminating disequilibrium effectively.
Supply and demand diagrams provide a clear visualisation of how markets operate.
They show the intersection where equilibrium occurs and highlight areas of disequilibrium such as excess supply or demand. Diagrams also help illustrate how shifts in curves change equilibrium price and quantity, making complex adjustments easier to interpret.
