
AQA Specification focus:
‘Apply knowledge of the basic model of demand and supply to a variety of real-world markets; be aware of the assumptions of the model of supply and demand.’
Introduction
The demand and supply model provides a structured framework for understanding how markets operate. Applying it requires recognising assumptions, limitations, and how real-world deviations affect outcomes.
Applying the Model of Demand and Supply
The basic model of demand and supply illustrates how equilibrium prices are determined through the interaction of buyers and sellers. By applying the model to different markets, economists can predict price changes, output levels, and market adjustments. The model is not only a theoretical construct but also a tool for analysing practical issues such as agricultural fluctuations, housing markets, and labour shortages.
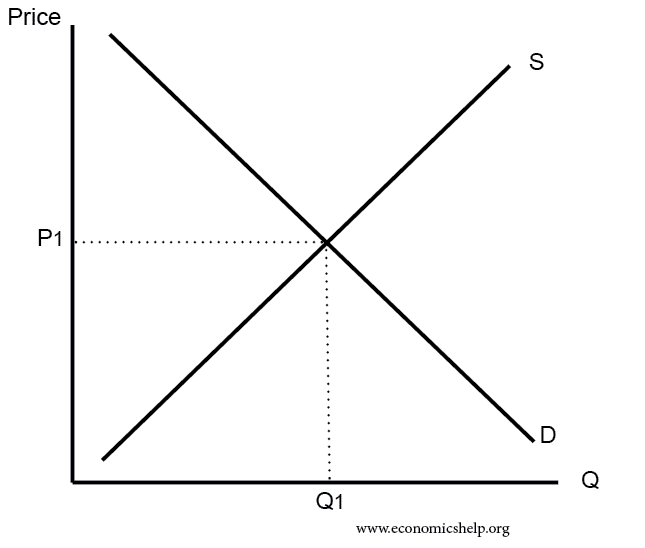
This diagram shows the intersection of the demand and supply curves, indicating the equilibrium price and quantity in a market. It demonstrates how shifts in demand or supply can lead to changes in market equilibrium, aligning with the study notes' explanation of equilibrium and disequilibrium. Source
When applying the model to real-world markets, diagrams showing shifts in demand curves or supply curves are essential. For instance, a rise in consumer incomes may shift demand outward, raising both equilibrium price and quantity, while a technological innovation may shift supply outward, lowering equilibrium price but increasing output.
Key Applications of the Model
Consumer markets: Explaining how shifts in consumer tastes or incomes alter prices and output.
Labour markets: Understanding how minimum wages affect equilibrium wage rates and employment levels.
Commodity markets: Predicting the effects of supply shocks, such as poor harvests or oil shortages.
Housing markets: Illustrating how planning restrictions shift supply curves, raising equilibrium prices.
These applications show that the model is flexible, but each requires careful evaluation of assumptions.
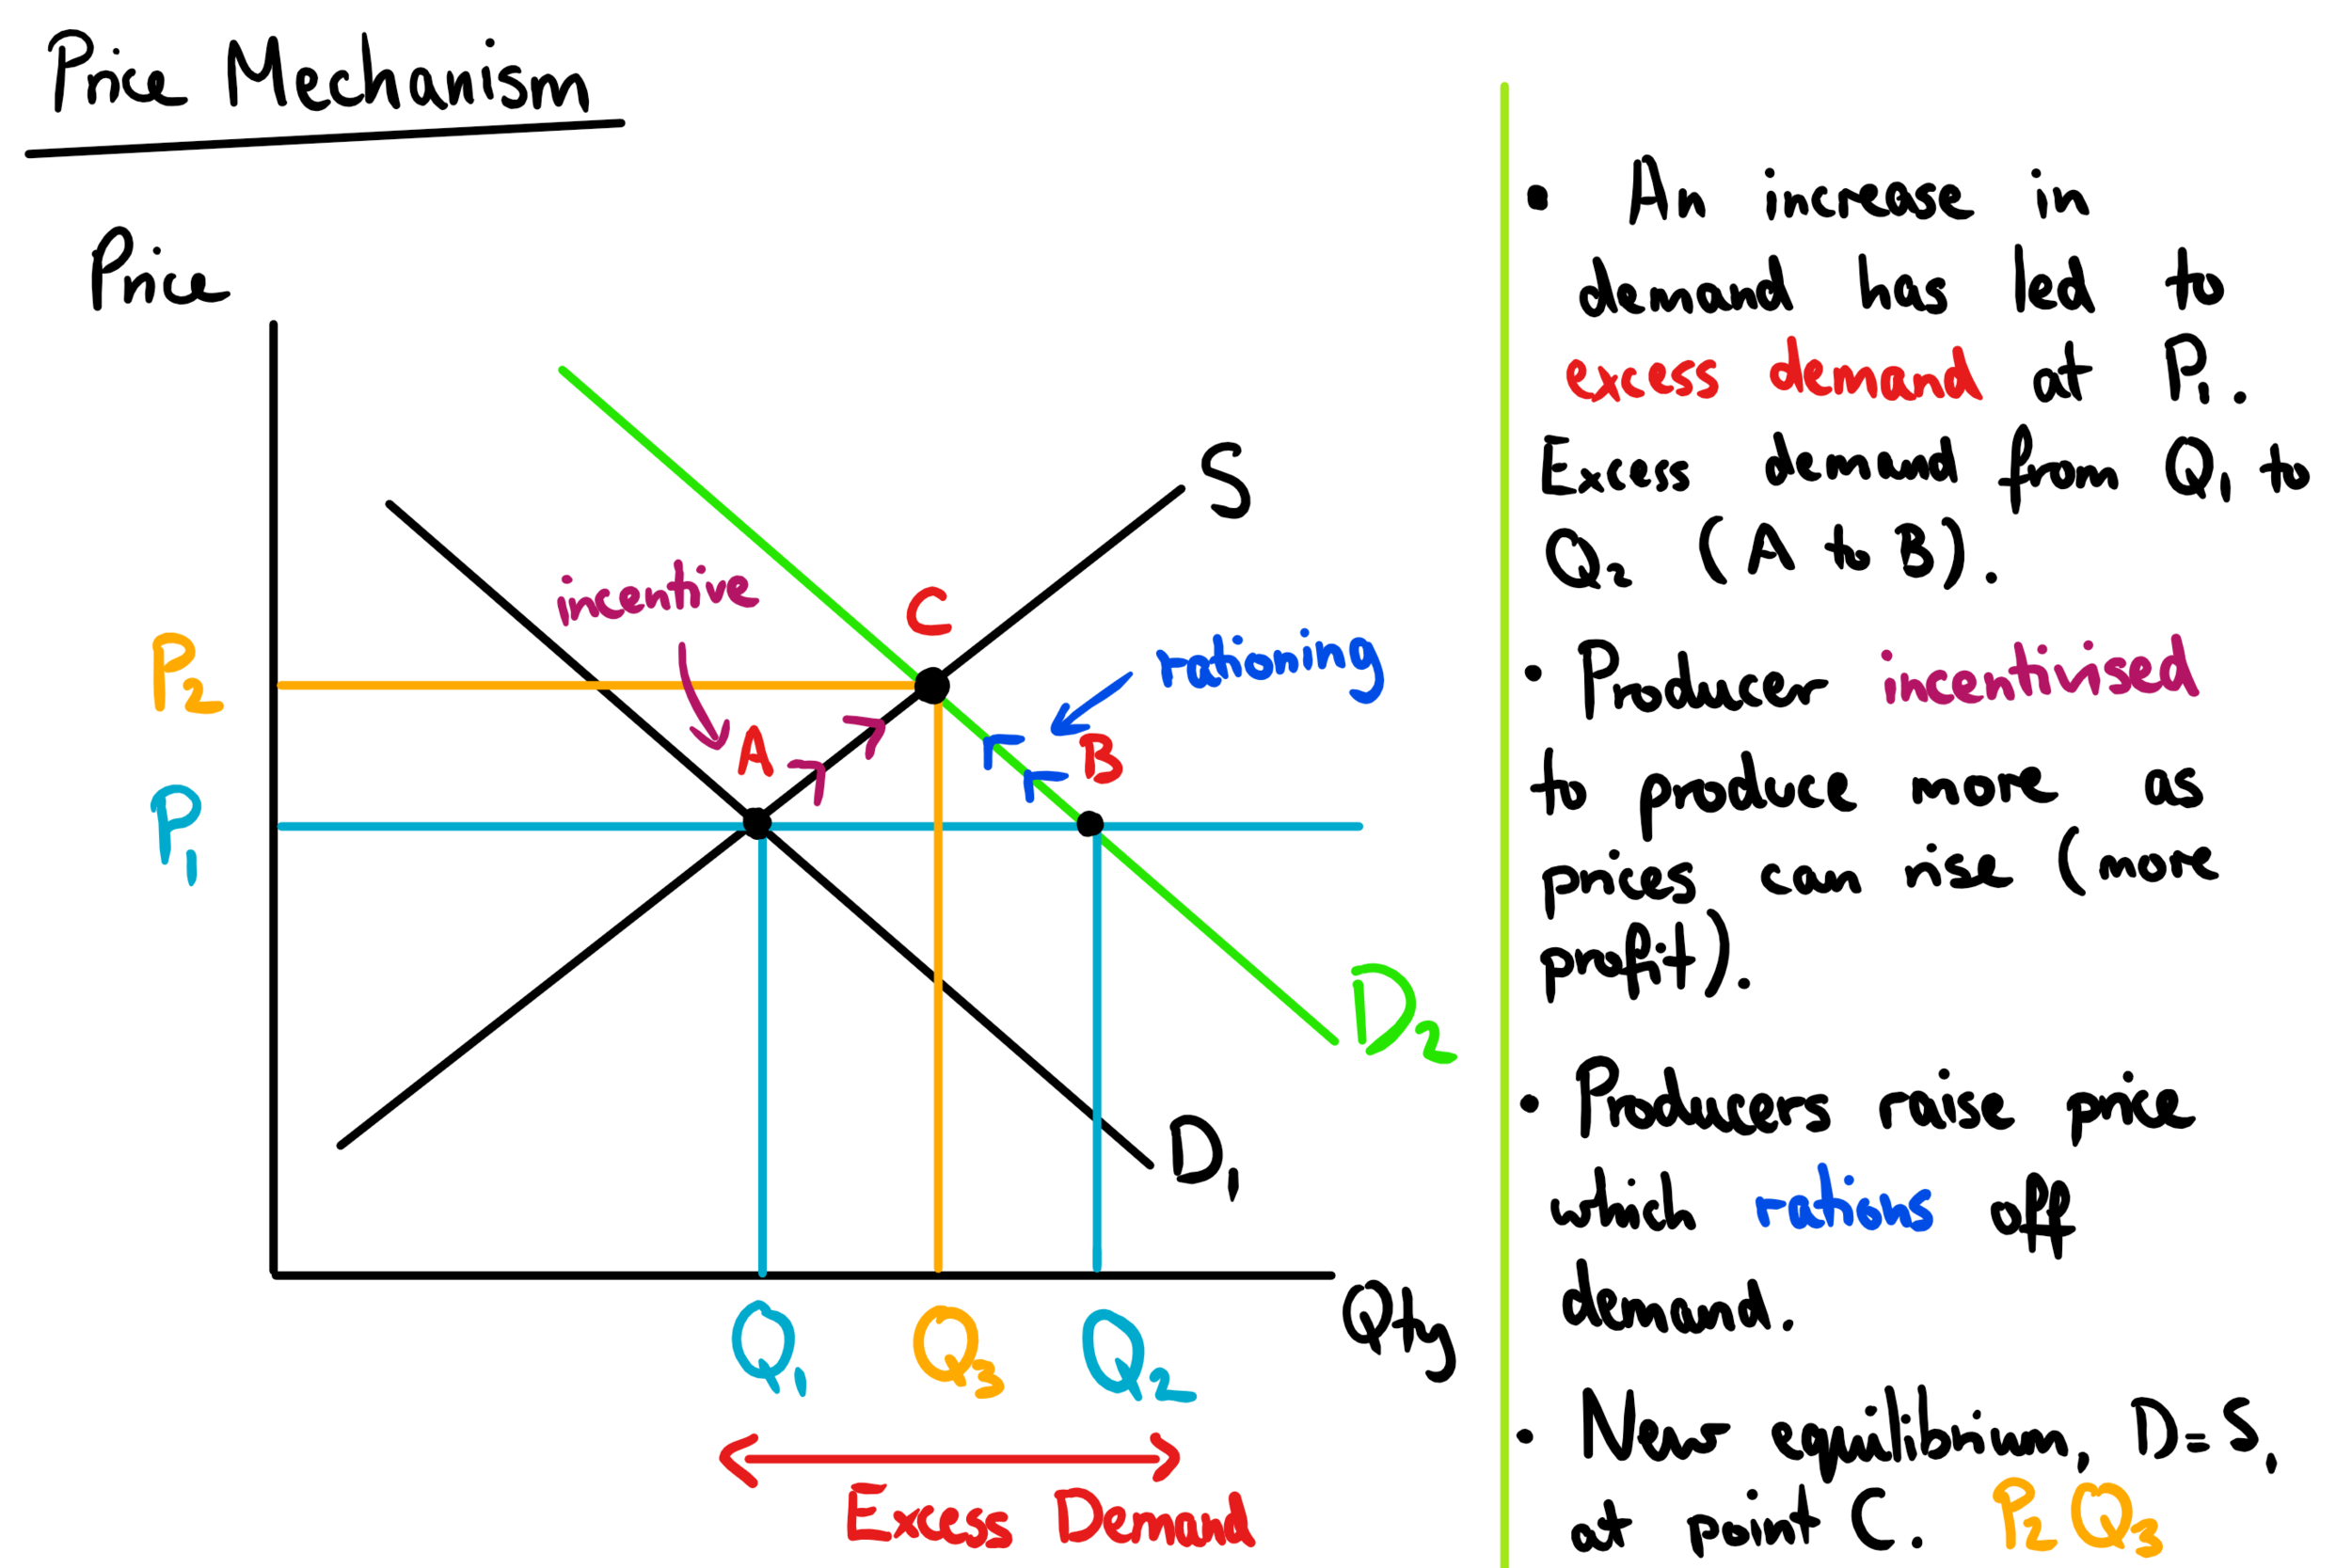
This diagram demonstrates the price mechanism in action, showing how shifts in demand and supply lead to changes in equilibrium price and quantity. It illustrates the dynamic nature of markets and the role of the price mechanism in resource allocation, as highlighted in the study notes. Source
Recognising the Assumptions of the Model
The demand and supply framework is based on several simplifying assumptions. While useful for analysis, these assumptions often diverge from reality.
Core Assumptions
Perfect competition: Many buyers and sellers, none with market power to influence price.
Homogeneous products: Goods and services are identical across sellers.
Perfect information: Buyers and sellers have complete knowledge of prices and products.
No transaction costs: Trading does not involve extra costs such as transport or search time.
Mobility of factors of production: Labour and capital can easily move between industries.
Ceteris paribus: Other factors remain constant when one variable changes.
Why Assumptions Matter
If assumptions are relaxed, predictions from the model may change. For example:
When firms have market power (monopolies or oligopolies), prices may not equal marginal cost.
If information is imperfect, consumers may not respond predictably to price changes.
Immobile labour can cause persistent unemployment even if wages adjust.
Government intervention, such as taxes or subsidies, shifts curves and alters equilibrium.
Extending the Model to Real-World Contexts
Demand-Side Deviations
Behavioural economics challenges the idea of rational consumers, showing that biases, habits, and imperfect foresight influence decisions.
Advertising and branding reduce product homogeneity, shifting demand in ways not predicted by simple models.
Supply-Side Deviations
Production lags: Farmers cannot instantly increase supply after a price rise due to growing cycles.
Capacity constraints: Firms may be unable to expand output in the short run, limiting responsiveness.
External shocks: Natural disasters or global events (e.g., financial crises) can cause sudden shifts in supply curves.
The Role of Elasticities in Applying the Model
Understanding price elasticity of demand (PED) and price elasticity of supply (PES) is critical for accurate application.
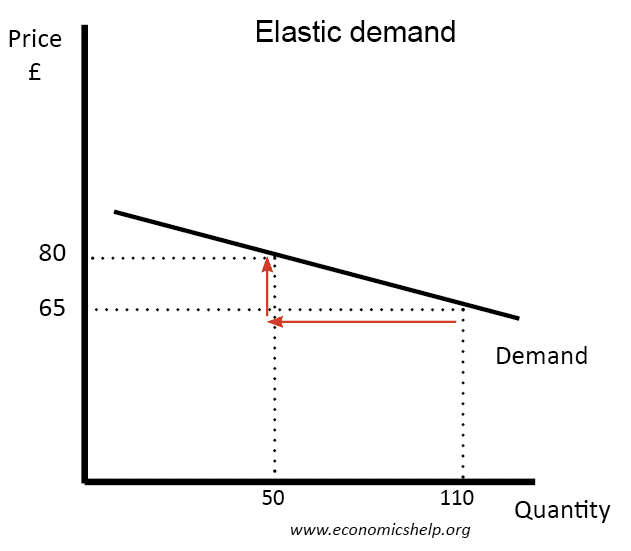
This diagram depicts various demand curves representing different price elasticities. It helps in understanding how the responsiveness of quantity demanded to price changes can affect total revenue, as discussed in the study notes. Source
Price Elasticity of Demand (PED): The responsiveness of quantity demanded to a change in price.
When demand is elastic, a small change in price results in a larger change in demand, amplifying the effects of shifts in supply. Conversely, when supply is inelastic, even small changes in demand can lead to significant price increases.
Government Policy and Market Outcomes
The demand and supply model is widely used to evaluate government intervention:
Indirect taxes shift the supply curve leftward, raising prices and lowering equilibrium quantity.
Subsidies shift the supply curve rightward, lowering prices and raising output.
Price ceilings (e.g., rent controls) create excess demand, while price floors (e.g., minimum wages) generate excess supply.
These outcomes highlight the importance of using the model as a guide to policy analysis, while also being aware of assumptions and real-world complexities.
Limitations of the Model
While the model is powerful, students must recognise its limitations:
Static framework: It assumes instant adjustment, ignoring time lags.
Simplified behaviour: Assumes rationality and ignores psychological factors.
Ignores externalities: Market prices do not reflect social costs or benefits.
Institutional factors: Regulations, trade unions, and government policies can reshape outcomes.
Thus, although the demand and supply model is foundational, it is not a complete representation of modern markets.
Practice Questions
State two assumptions of the basic model of demand and supply. (2 marks)
1 mark for each correct assumption stated, up to 2 marks.
Acceptable answers include:
Perfect competition (many buyers and sellers).
Homogeneous products.
Perfect information.
No transaction costs.
Mobility of factors of production.
Ceteris paribus (other factors remain constant).
Using a demand and supply diagram, explain how excess supply leads to a change in equilibrium price. (6 marks)
1 mark for correctly drawing and labelling a demand and supply diagram with excess supply indicated.
1 mark for correctly identifying that excess supply occurs when price is set above equilibrium.
1 mark for explaining that excess supply creates downward pressure on price.
1 mark for showing that as price falls, quantity demanded increases.
1 mark for showing that as price falls, quantity supplied decreases.
1 mark for concluding that the market returns to a new or original equilibrium where demand equals supply.
Maximum 6 marks.
FAQ
Housing markets often involve long time lags in supply, since construction takes years to complete. This makes supply highly inelastic in the short run.
Government policies such as planning restrictions and subsidies further distort market outcomes compared with the assumptions of the basic model. Imperfect information, such as uncertainty about future prices, also limits the model’s accuracy.
Most real-world markets feature firms with some degree of market power, allowing them to influence prices.
Products are often differentiated rather than homogeneous, through branding, advertising, or quality differences. This means that the simple demand and supply framework only provides an approximation rather than a precise representation.
Time lags occur when producers cannot instantly adjust supply in response to price changes.
Agriculture: crops cannot be grown overnight.
Manufacturing: investment in new machinery takes time.
Labour markets: retraining workers requires years.
This slows the adjustment process, meaning equilibrium is not reached as quickly as the model suggests.
The model isolates the impact of one variable change at a time, such as a price increase.
Without ceteris paribus, multiple variables could shift simultaneously, making it difficult to attribute effects to a single factor. Although useful for analysis, this assumption oversimplifies real-world markets where many factors change together.
Regulations such as minimum wages, rent controls, and environmental standards restrict the free movement of prices.
These interventions mean markets cannot always adjust naturally to changes in demand and supply. As a result, the model’s assumption of no external interference is often unrealistic, especially in highly regulated industries like energy or healthcare.
