
AQA Specification focus:
‘How factor prices and productivity affect firms’ costs of production and their choice of factor inputs; students should be able to calculate different costs from given data and draw and interpret cost curves.’
Understanding the drivers of costs is essential in economics as it explains how firms’ expenses are shaped by factor prices, productivity, and resource choices within competitive markets.
Factor Prices as Drivers of Costs
The cost structure of a firm is heavily influenced by the prices of factors of production such as labour, land, capital, and raw materials.
Labour costs depend on wage rates, training expenses, and non-wage costs such as pensions or healthcare contributions.
Capital costs involve interest rates, leasing charges, and depreciation of machinery.
Raw material costs fluctuate depending on global supply and demand conditions.
Land and rent costs reflect geographical location and market conditions.
A rise in any factor price increases total costs and shifts the firm’s cost curves upwards, affecting competitiveness and profitability.
Factor Prices: The payments made for the use of factors of production, including wages for labour, rent for land, interest for capital, and profit for enterprise.
Because firms seek to minimise costs, they often adjust their choice of factor inputs. For example, if labour becomes more expensive, a firm may substitute machines (capital) for workers.
Productivity and Its Role in Costs
Productivity is another major driver of costs. Higher productivity means more output is generated from the same input, effectively lowering the average cost of production.
Productivity: The measure of output per unit of input, commonly measured as output per worker per hour in the case of labour productivity.
Improvements in productivity can occur due to:
Better training and education of workers.
Technological innovations improving production processes.
Economies of scale lowering unit costs as firms grow larger.
When productivity rises, firms spread fixed costs over more units and reduce average variable costs, lowering the average total cost curve.
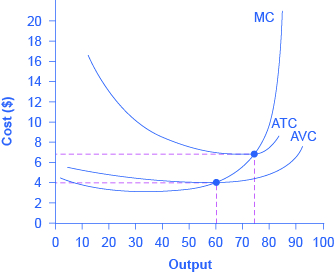
This diagram shows the typical U-shaped short-run cost curves: MC, AVC, and ATC. The MC curve intersects AVC and ATC at their minimum points, reflecting diminishing returns. Source
Applied Cost Calculations
Students should be able to calculate and interpret key cost measures. These are essential in understanding how factor prices and productivity translate into measurable costs.
EQUATION
Total Cost (TC) = Total Fixed Cost (TFC) + Total Variable Cost (TVC)
TC = The overall cost of production
TFC = Costs that do not change with output (e.g., rent, insurance)
TVC = Costs that vary directly with output (e.g., wages, raw materials)
Average Cost (AC) = Total Cost ÷ Quantity of Output (Q)
AC = Cost per unit of output
Q = Number of units produced
Marginal Cost (MC) = Change in Total Cost ÷ Change in Output
MC = Additional cost of producing one more unit of output
These calculations allow economists and firms to interpret cost curves. For example, marginal cost typically falls at first due to increasing returns but eventually rises because of diminishing returns in the short run.
Cost Curves and Drivers
The shapes of cost curves reflect the interaction of factor prices and productivity:
Short run: Fixed factors create diminishing returns, giving U-shaped average cost and rising marginal cost curves.
Long run: All factors are variable, and costs are shaped by returns to scale and economies of scale.
When factor prices rise, all cost curves shift upwards. When productivity improves, average and marginal costs shift downwards.
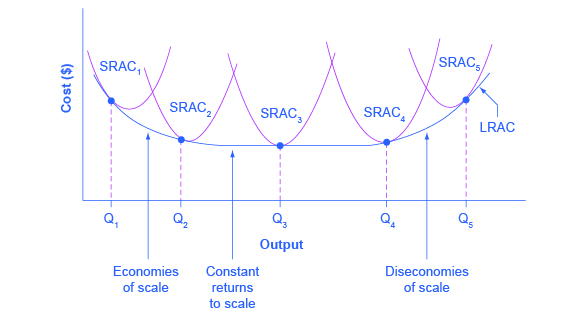
This diagram illustrates the LRAC curve as an envelope of SRAC curves. Each SRAC represents fixed inputs, while LRAC shows the lowest achievable average cost when all factors are variable. Source
The Role of Factor Substitution
Firms constantly adjust their production methods depending on the relative costs of inputs.
If capital becomes cheaper relative to labour, firms may adopt more machinery (capital-intensive production).
If labour is abundant and cheap, firms may rely more on workers (labour-intensive production).
This substitution directly affects the firm’s cost-minimisation strategy and, ultimately, its competitiveness in the market.
Dynamic Drivers of Costs
Several external and internal factors can alter the cost structure of a firm:
Wage Rate Changes
Strong trade unions or minimum wage laws can increase labour costs.
Globalisation may lower wage costs if production shifts to lower-wage countries.
Technology
Automation reduces reliance on labour, cutting variable costs.
Innovation can reduce raw material waste, lowering input costs.
Productivity Growth
Training schemes and education investments boost efficiency.
Enhanced labour motivation (through pay schemes) increases output per worker.
Factor Input Prices
Global commodity price fluctuations (e.g., oil) directly affect variable costs.
Changes in interest rates affect borrowing costs and capital investment.
Interpreting Cost Curves in Context
Students must be able to draw and interpret cost curves based on data provided. Understanding the relationship between marginal, average, and total costs is crucial:
When MC < AC, the average cost falls.
When MC > AC, the average cost rises.
The MC curve always intersects the AC curve at its minimum point.
These relationships show how productivity improvements and changes in factor prices influence the cost structure of firms.
Practice Questions
Define marginal cost and explain how it is calculated. (2 marks)
1 mark for correctly defining marginal cost: the additional cost of producing one more unit of output.
1 mark for stating calculation: change in total cost divided by change in output.
Explain how changes in productivity and factor prices influence a firm’s cost curves in the short run and long run. (6 marks)
1–2 marks: Basic explanation of productivity (output per input) and factor prices (cost of labour, capital, etc.).
1–2 marks: Application to short-run costs, e.g. productivity improvements lower average variable costs, factor price increases shift cost curves upwards.
1–2 marks: Application to long-run costs, e.g. productivity growth lowers long-run average cost curve; rising factor prices increase minimum efficient scale or raise LRAC.
To gain full marks, answers must clearly link changes in productivity and factor prices to movements/shifts in cost curves.
FAQ
Rising energy prices increase variable costs, as they directly affect production inputs such as electricity and fuel. This leads to higher total costs and upward shifts in marginal cost (MC) and average cost (AC) curves in the short run.
If energy is a major input, even small increases in price can significantly raise unit costs, reducing competitiveness. Firms with energy-efficient technology may experience less severe impacts.
While higher productivity typically lowers average costs, it may not always do so if:
The cost of introducing new technology is very high.
Workers resist changes, leading to inefficiencies.
There are diminishing returns to productivity gains in the short run.
In some cases, firms may see productivity improvements offset by increased wages or training expenses.
Firms compare the relative costs of inputs when deciding how to produce:
If wages rise relative to machinery costs, firms substitute labour with capital (automation).
If technology is expensive but labour is cheap, firms may remain labour-intensive.
Government policy, such as subsidies for equipment or labour market regulation, also affects this choice.
Shift in cost curves: Occurs when factor prices or productivity change, affecting costs at every level of output (e.g., higher wages shift AC upwards).
Movement along cost curves: Happens when output changes but factor prices and productivity remain constant, altering costs only for that level of production.
Understanding this distinction helps explain whether changes are due to external cost drivers or simply changes in scale.
Global markets influence factor input prices such as oil, metals, and agricultural products. For example:
A rise in global oil prices increases transport and raw material costs.
Currency fluctuations change the price of imported inputs.
Domestic firms reliant on imports face greater volatility in costs, while those sourcing locally may be shielded. This shows the importance of international markets in determining firm-level cost structures.
