
AQA Specification focus:
‘Students should be able to apply efficiency concepts when comparing the performance of firms in markets with different structures. They should understand how conduct and performance indicators can be used to compare market structures.’
Efficiency provides a crucial framework for comparing market structures, highlighting how firms operate, allocate resources, and perform under different competitive conditions, from perfect competition to monopoly.
Efficiency Concepts in Market Structures
Static vs Dynamic Efficiency
Static efficiency refers to short-term efficiency outcomes within a given level of technology. It includes both allocative efficiency and productive efficiency.
Dynamic efficiency considers how efficiency changes over time, particularly through innovation, research and development, and investment.
Allocative efficiency: Achieved when price (P) equals marginal cost (MC), ensuring resources are distributed to maximise consumer and producer welfare.
Productive efficiency: Occurs when firms produce at the lowest point of their average total cost (ATC), minimising waste and maximising output from given inputs.
Conduct and Performance Indicators
When comparing market structures, economists assess both firm behaviour (conduct) and outcomes (performance):
Conduct: How firms set prices, output, invest, advertise, and innovate.
Performance: Measured by efficiency outcomes, profitability, consumer welfare, and levels of innovation.
Perfect Competition as a Benchmark
In perfect competition, assumptions such as many firms, homogenous products, and free entry and exit lead to strong efficiency outcomes:
Allocative efficiency: Always achieved in the long run, as P = MC.
Productive efficiency: Firms minimise costs due to intense competition.
Dynamic efficiency: Often weak, as low profits limit research and innovation.
Thus, perfect competition is frequently used as a benchmark against which other structures are judged.
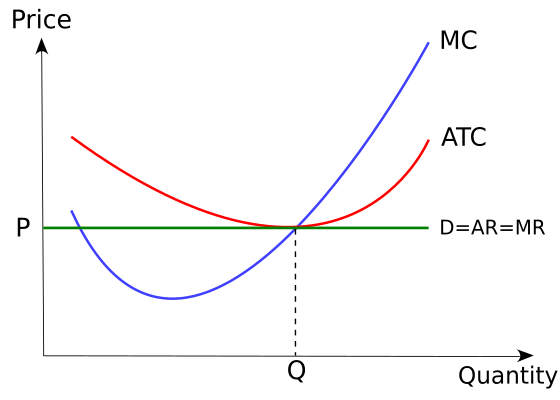
Cost curves for a perfectly competitive firm in long-run equilibrium. Price equals marginal cost at the minimum of the average cost curve, so both allocative and productive efficiency are achieved. The horizontal line is P = AR = MR, consistent with price-taking behaviour. Source
Monopolistic Competition
In monopolistic competition, product differentiation and limited market power influence efficiency:
Allocative efficiency: Not fully achieved since P > MC.
Productive efficiency: Firms operate with excess capacity, meaning ATC is not minimised.
Dynamic efficiency: Moderate, as firms invest in non-price competition (branding, product variety).
Performance indicators show that while consumer choice expands, efficiency relative to perfect competition is reduced.
Oligopoly and Efficiency Outcomes
Oligopolistic markets show diverse outcomes depending on whether firms compete or collude.
Allocative efficiency: Can be low if firms collude and restrict output to raise prices, behaving like monopolists.
Productive efficiency: Large firms may benefit from economies of scale, lowering average costs.
Dynamic efficiency: Often high, as abnormal profits enable significant R&D, fostering innovation.
Economies of scale: Reductions in average cost as firm size and output increase, allowing greater efficiency at large-scale production.
Conduct indicators such as cartel formation or price wars highlight the interdependence of oligopolistic firms, shaping performance outcomes.
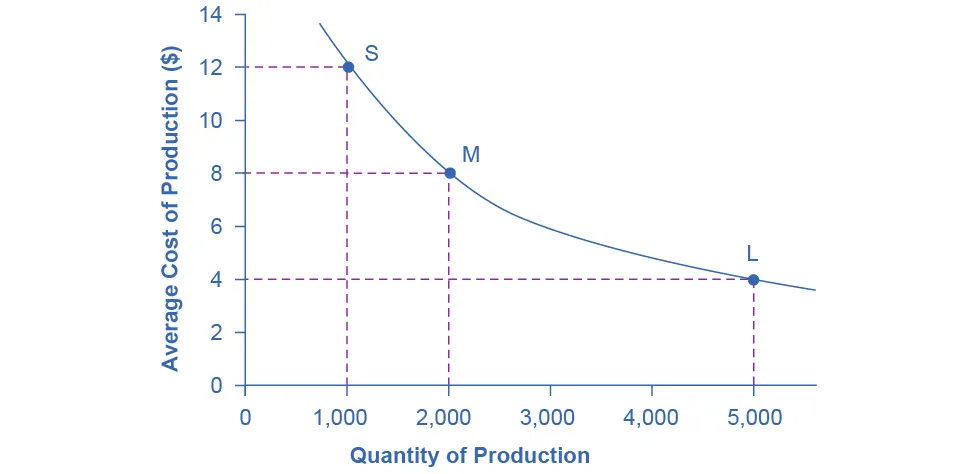
Long-run average cost falling with output, illustrating economies of scale. Use it to interpret why some oligopolies can operate at lower average costs than smaller rivals. The labelled points (S, M, L) are example scales and not required by AQA. Source
Monopoly and Efficiency Implications
A pure monopoly typically reduces efficiency compared with competitive structures:
Allocative efficiency: Not achieved, since P > MC, creating deadweight loss.
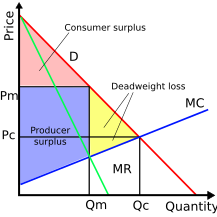
Welfare areas under monopoly. The shaded triangle is the deadweight loss that arises because price exceeds marginal cost at the monopolist’s quantity. Curves include Demand, MR, and MC, making the efficiency comparison transparent. Source
Productive efficiency: May be undermined by lack of competition, leading to X-inefficiency (slack in cost control).
Dynamic efficiency: Potentially strong, as monopoly profits allow significant reinvestment into innovation.
X-inefficiency: Inefficiency that arises when firms face limited competitive pressure, leading to higher-than-necessary costs.
Performance indicators reveal a trade-off: reduced short-run efficiency but possible long-run innovation gains.
Comparing Efficiency Across Structures
Economists apply efficiency concepts to systematically compare outcomes:
Perfect competition ensures maximum allocative and productive efficiency, but weak dynamic incentives.
Monopolistic competition sacrifices efficiency for greater consumer choice and product differentiation.
Oligopoly balances potential inefficiencies with strong dynamic gains if firms innovate.
Monopoly restricts short-run efficiency but may deliver dynamic efficiency through long-term R&D.
Conduct and Performance in Application
When comparing market structures, both conduct and performance indicators are essential:
Conduct indicators: pricing strategies, output decisions, investment levels, non-price competition.
Performance indicators: cost efficiency, innovation levels, consumer satisfaction, and long-term growth.
By applying these measures, students can evaluate how well different structures allocate resources, enhance welfare, and promote innovation.
Practice Questions
Define allocative efficiency and explain how it can be used to compare different market structures. (2 marks)
1 mark for a correct definition of allocative efficiency (e.g. occurs when P = MC).
1 mark for recognising how it allows comparisons between market structures (e.g. perfect competition achieves allocative efficiency, whereas monopoly does not).
Using efficiency concepts, explain how the performance of monopoly and perfect competition can be compared. (6 marks)
Up to 2 marks for accurate explanation of efficiency types (allocative, productive, dynamic).
Up to 2 marks for application to perfect competition (e.g. allocative and productive efficiency in long run, but weak dynamic efficiency).
Up to 2 marks for application to monopoly (e.g. allocative and productive inefficiency but potential for strong dynamic efficiency through innovation and investment).
Maximum 6 marks overall. Answers must reference efficiency concepts explicitly to access full marks.
FAQ
Conduct indicators focus on firm behaviour, such as pricing strategies, investment, and innovation. Performance indicators assess outcomes, like efficiency, profitability, and consumer welfare.
When applied together, conduct explains why firms behave in certain ways, while performance reveals the results of those behaviours in different market structures.
Perfect competition ensures both allocative and productive efficiency in the long run, meaning resources are optimally allocated and production is cost-minimised.
It provides a clear theoretical standard, allowing economists to measure the extent of efficiency loss or gain in imperfect markets like monopolies or oligopolies.
Innovation is tied to dynamic efficiency, which looks at improvements over time.
Monopolies and oligopolies often have the resources to invest in R&D.
Perfectly competitive markets may lack sufficient profit margins to innovate.
Therefore, dynamic efficiency comparisons highlight the long-term benefits or drawbacks of different structures.
X-inefficiency arises when firms lack competitive pressure, leading to higher-than-necessary production costs.
Monopolies are particularly prone to this since their market power reduces incentives to control costs. Competitive markets, however, tend to minimise X-inefficiency due to constant rivalry.
Yes. Policymakers use efficiency comparisons to judge whether intervention is necessary.
If a monopoly sacrifices allocative efficiency but offers strong dynamic efficiency, regulation may aim to preserve innovation while reducing welfare loss.
In competitive markets, intervention may focus less on efficiency and more on protecting fair competition and preventing collusion.
