
AQA Specification focus:
‘A diagrammatic analysis of price discrimination is expected.’
Introduction
Price discrimination occurs when a firm charges different prices to different consumers for the same good or service, not justified by cost differences. Diagrammatic analysis demonstrates its effects.
Understanding Price Discrimination
Price discrimination is a pricing strategy employed by firms with monopoly power or significant market influence. It arises when firms can segment markets and prevent resale between consumer groups.
Price Discrimination: The practice of charging different prices to different groups of consumers for the same product, not due to differences in production costs.
This practice allows firms to extract more consumer surplus, converting it into producer surplus and increasing overall profitability.
Conditions for Price Discrimination
Before exploring diagrams, it is essential to recall the conditions enabling price discrimination:
The firm must possess market power (price-making ability).
Consumers must have different price elasticities of demand.
Resale must be prevented, ensuring separation between markets.
Types of Price Discrimination
Price discrimination occurs in several forms, which influence the diagrammatic analysis:
First-degree (perfect): Each consumer pays their maximum willingness to pay.
Second-degree: Price varies with the quantity consumed or product version.
Third-degree: Different groups of consumers pay different prices based on elasticity.
In AQA A-Level Economics, third-degree discrimination is the most commonly illustrated.
Third-Degree Price Discrimination: Diagrammatic Analysis
Third-degree price discrimination is shown using diagrams that separate markets with differing demand elasticities.
Step 1: Aggregate Market Conditions
The monopolist faces a total marginal cost (MC) and marginal revenue (MR) curve for combined production.
The firm allocates output between markets to maximise profits where MC = MR in total.
Profit-Maximising Condition: MC = MR
MC = Marginal Cost (change in total cost from one extra unit)
MR = Marginal Revenue (change in total revenue from one extra unit)
Step 2: Separate Market Analysis
In separate diagrams:
The more inelastic demand group is charged a higher price.
The more elastic demand group is charged a lower price.
This occurs because raising price in the inelastic market causes a smaller fall in quantity demanded compared to the elastic market.
Step 3: Overall Diagram
The firm’s total marginal revenue curve is derived by horizontally summing the MR curves of both markets.
Output is distributed between markets so that MC = MR in each market, ensuring profit maximisation.
Total industry output is chosen where the horizontal sum of marginal revenues equals MC, then split across segments until MR₁ = MR₂ = MC in each market.
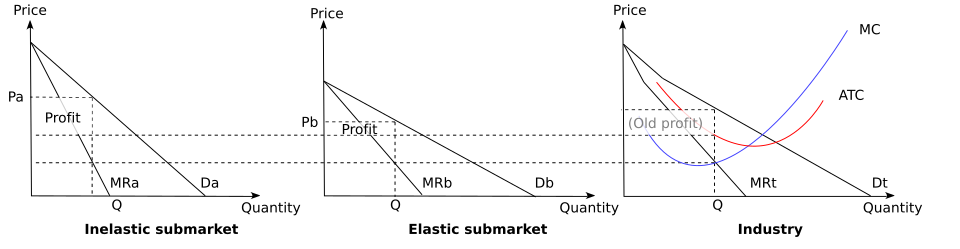
Three linked panels for third-degree price discrimination. The right-hand panel shows Total MR intersecting MC to give output; left panels allocate quantities so MR₁ = MR₂ = MC. Labels highlight profits and demand elasticity differences. Source
Welfare Effects
The diagrammatic analysis shows redistribution of surplus:
Consumer surplus falls, as some is transferred to producers.
Producer surplus rises, as firms capture more willingness to pay.
The overall welfare outcome depends on whether output expands or contracts relative to uniform pricing.
Consumer Surplus: The difference between what consumers are willing to pay and what they actually pay.
Producer Surplus: The difference between the price received by firms and the minimum they would accept.
Real-World Illustrations
Diagrams of price discrimination should be related to real-world contexts to aid understanding:
Rail travel: Peak vs off-peak tickets.
Cinema pricing: Cheaper tickets for students and seniors.
Airline tickets: Higher prices for business travellers with inelastic demand.
These examples match diagrams where consumer groups face different demand curve slopes.
Efficiency and Equity Considerations
Diagrammatic analysis also allows evaluation:
Allocative efficiency: May improve if discrimination expands output compared to uniform monopoly pricing.
Productive efficiency: May be unaffected unless increased revenue leads to cost reductions.
Equity: Some groups pay higher prices, raising fairness concerns.
Advantages
Can lead to increased output and broader market access.
May cross-subsidise services (e.g., cheaper student transport funded by higher business fares).
Disadvantages
Transfers welfare from consumers to producers.
Higher prices for some groups reduce affordability.
Diagrammatic Summary
In exam diagrams:
Label both market demand curves (D1, D2) with corresponding MR curves.
Show MC intersecting total MR to determine aggregate output.
Indicate allocation of quantity between markets.
Mark higher price in inelastic market and lower price in elastic market.
This diagrammatic process is essential to demonstrate the impact on prices, output, and welfare in line with AQA requirements.
Compared with uniform pricing, price discrimination can reduce deadweight loss by expanding output towards the allocatively efficient point where P = MC.
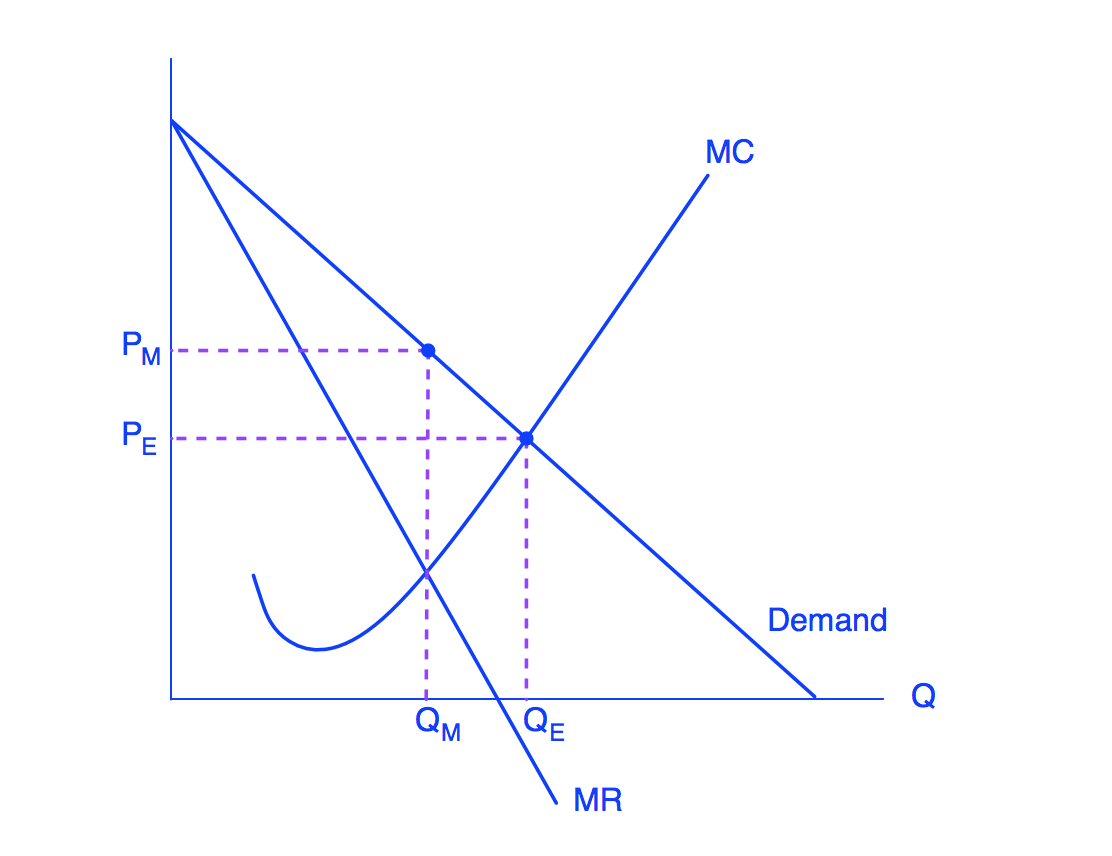
Diagram showing Demand, MR, and MC with monopoly output (Q_M, P_M) and higher-output outcome (Q_E, P_E) under price discrimination. It illustrates how discriminatory pricing can reduce deadweight loss by moving output closer to allocative efficiency. Source
Practice Questions
Define price discrimination and state one condition necessary for a firm to practise it. (2 marks)
1 mark for a correct definition: Price discrimination is when a firm charges different prices to different consumers for the same product, not due to cost differences.
1 mark for stating a correct condition, e.g.:
The firm must have some degree of monopoly power.
Markets must be kept separate to prevent resale.
Different groups of consumers must have different price elasticities of demand.
Using an appropriate diagram, explain how a monopolist practising third-degree price discrimination can maximise profits across two different markets. (6 marks)
Up to 2 marks for an accurate and well-labelled diagram showing:
Two separate markets with different demand elasticities (D1/MR1 and D2/MR2).
Combined marginal revenue curve and profit-maximising output where MC = total MR.
Up to 2 marks for explanation that:
The firm sets output in each market so that MR = MC.
The price is higher in the inelastic market and lower in the elastic market.
Up to 2 marks for analysis of profit maximisation:
Consumer surplus is reduced and converted into producer surplus.
Output allocation differs across markets due to varying elasticities.
(Maximum: 6 marks)
FAQ
Third-degree price discrimination uses separate demand and marginal revenue curves for different groups, each with distinct elasticity. The firm charges higher prices in inelastic markets and lower prices in elastic markets.
First-degree price discrimination, sometimes called perfect discrimination, removes consumer surplus entirely by charging each consumer their maximum willingness to pay. Diagrammatically, the area under the demand curve becomes producer revenue, leaving no consumer surplus.
Diagrams visually demonstrate how output and pricing decisions differ under discrimination compared to uniform monopoly pricing. They show:
The combined marginal revenue curve across markets.
Allocation of output between markets where MR = MC.
Shifts in consumer and producer surplus.
Without diagrams, it is difficult to fully illustrate the mechanics of discriminatory pricing and its welfare effects.
Diagrams highlight how surplus shifts:
Consumer surplus contracts as firms capture willingness to pay.
Producer surplus expands through higher profits.
Deadweight loss may shrink if total output rises compared to uniform pricing.
This visualisation allows students to assess whether price discrimination improves allocative efficiency or worsens equity outcomes.
Three panels are typically used for clarity:
Panel one: Demand and MR for market A.
Panel two: Demand and MR for market B.
Panel three: Combined MR with MC, determining total output.
This structure ensures students can see both the firm’s overall decision-making and the distribution of output between different consumer groups.
Elasticity determines price levels in diagrams:
In markets with inelastic demand, the price is higher, and quantity lower.
In markets with elastic demand, the price is lower, and quantity higher.
The slope of each demand curve reflects this difference, making elasticity crucial in explaining why firms set different prices across markets.

.svg)