
AQA Specification focus:
‘Runoff variation and the flood hydrograph.’
Runoff and flood hydrographs reveal how precipitation is transferred through a drainage basin, highlighting key factors that influence water movement, peak discharge, and flooding potential.
Runoff Variation and the Flood Hydrograph
What Is Runoff?
Runoff refers to the portion of precipitation that flows over the land surface and into rivers or streams. It is a key output in the drainage basin system, representing the movement of water from land to channel systems, especially when the ground is saturated or impermeable.
Runoff is influenced by multiple factors and varies significantly across different landscapes and temporal conditions. It plays a vital role in shaping flood patterns and is best analysed using a flood hydrograph.
Runoff: The flow of water that occurs when excess stormwater, meltwater, or other sources flow over the Earth’s surface.
What Is a Flood Hydrograph?
A flood hydrograph is a graph that shows how a drainage basin responds to a rainfall event. It plots discharge (volume of water passing through a river channel) over time and highlights key components such as lag time, peak discharge, and rising/falling limb.
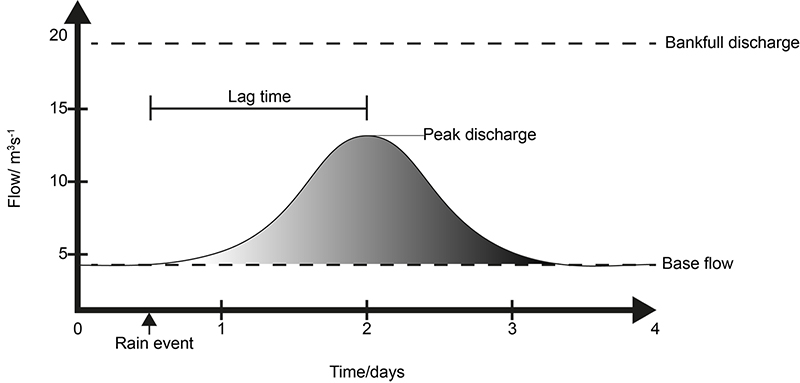
Figure 4 A labelled storm hydrograph showing baseflow, lag time, bank-full flow, peak discharge and time above threshold in response to a storm event. Source
Flood Hydrograph: A graph showing river discharge over time in response to a rainfall event.
Hydrographs can vary in shape depending on physical and human factors in the drainage basin. A “flashy” hydrograph has a short lag time and high peak discharge, while a “subdued” hydrograph has a long lag time and lower peak discharge.
Key Components of a Flood Hydrograph
Peak Discharge: The highest flow rate in the river following a rainfall event.
Lag Time: The time between peak rainfall and peak discharge.
Rising Limb: The upward slope showing increasing discharge.
Falling Limb: The downward slope showing decreasing discharge.
Base Flow: Normal river flow before and after the storm event.
These elements help hydrologists understand flood risk and the responsiveness of a basin to rainfall.
Factors Influencing Runoff Variation
Runoff levels vary based on a complex interplay of meteorological, geological, topographical, vegetative, and human factors. These variations affect both the volume and timing of water entering a river.
1. Precipitation Characteristics
Intensity: Heavy rain increases surface runoff due to limited infiltration.
Duration: Long rainfall saturates the ground, leading to more overland flow.
Type: Rain produces quicker runoff than snow, which melts gradually.
2. Temperature and Evapotranspiration
Warm conditions increase evapotranspiration, reducing water availability.
Cold, frozen ground reduces infiltration and increases surface flow.
3. Soil and Rock Type
Impermeable soils (e.g. clay) and rocks (e.g. granite) limit infiltration and promote runoff.
Permeable soils (e.g. sandy soils) increase infiltration, reducing runoff.
4. Vegetation Cover
Dense vegetation increases interception, infiltration, and evapotranspiration, delaying runoff.
Deforested areas have reduced interception, increasing rapid runoff.
5. Land Use and Urbanisation
Urban surfaces (concrete, tarmac) are impermeable, enhancing runoff.
Drainage networks in cities accelerate water transfer to rivers.
6. Topography
Steeper slopes cause faster runoff, while flat areas encourage water storage and infiltration.
Human Impacts on Runoff and Hydrographs
Human activities can significantly alter the natural water flow within a drainage basin.
Urbanisation: Replaces natural land cover with impermeable surfaces, shortening lag time and increasing peak discharge.
Deforestation: Reduces interception and root water uptake, enhancing overland flow.
Agriculture: Ploughing and irrigation can alter infiltration and surface flow dynamics.
River Engineering: Dams and channel modifications can artificially store or redirect water, impacting hydrograph shape.
Urbanisation: The expansion of towns and cities, typically involving an increase in impermeable surfaces that reduce infiltration and increase surface runoff.
Seasonal and Temporal Variation in Runoff
Runoff can vary throughout the year depending on seasonal weather patterns and climate.
Winter: Ground may be frozen, increasing runoff. Snowmelt can cause sharp rises in discharge during early spring.
Summer: Dry soil may resist infiltration initially, causing high surface runoff during storms.
Monsoon/Storm Events: Intense rainfall during specific seasons can result in high runoff and potential flooding.
Flood Risk and Hydrograph Response
Flood hydrographs provide a critical tool in assessing flood risk, especially in response to changing precipitation patterns and land use. A flashy hydrograph is often associated with higher flood risk due to:
Short lag time
Steep rising limb
High peak discharge
Real-world hydrographs, such as those obtained from stream gauges, illustrate how actual catchments respond to precipitation events.
Example Storm-Flow Discharge Hydrograph A USGS hydrograph from the Oklahoma-Texas Water Science Center showing storm-flow discharge over time with sampling times for water-quality and suspended sediment. Source
Modifying Hydrographs Through Management
Various sustainable drainage systems (SuDS) and engineering strategies are used to manage runoff and alter flood hydrographs:
Afforestation: Increases interception and infiltration.
Green roofs and permeable pavements: Promote infiltration in urban areas.
Retention basins: Temporarily store excess water and reduce peak discharge.
River restoration: Reintroduces natural meanders and wetlands to delay water movement.
These interventions aim to lengthen lag time, reduce peak discharge, and create a more subdued hydrograph, thereby lowering flood potential.
Sustainable Drainage Systems (SuDS): Urban design strategies that manage surface water sustainably by mimicking natural drainage processes.
Hydrograph analysis continues to be vital for planning flood defences and understanding the hydrological response of catchments, particularly in light of increasing extreme weather events linked to climate change.
Practice Questions
Define the term lag time and explain how it is shown on a flood hydrograph. (3 marks)
Mark Scheme (3 marks total)
1 mark for accurate definition: Lag time is the period of time between peak rainfall and peak discharge.
1 mark for identifying how it is shown: It is represented as the horizontal distance between the peak of the rainfall and the peak of the discharge curve on the hydrograph.
1 mark for clarity or elaboration: Short lag time indicates rapid runoff, often due to impermeable surfaces or steep slopes.
Explain how urbanisation and deforestation can influence the shape of a flood hydrograph. (6 marks)
Mark Scheme (6 marks total)
Up to 3 marks for urbanisation:
1 mark: Urban areas have more impermeable surfaces (e.g. roads, pavements).
1 mark: This reduces infiltration and increases surface runoff.
1 mark: Leads to shorter lag time and higher peak discharge, producing a “flashy” hydrograph.
Up to 3 marks for deforestation:
1 mark: Trees intercept rainfall and promote infiltration through root systems.
1 mark: Removing trees reduces interception and increases overland flow.
1 mark: This shortens lag time and increases flood risk, steepening the rising limb.
Credit clear, relevant use of terminology (e.g. infiltration, discharge, runoff) and linkage to hydrograph shape for full marks.
FAQ
Flashy hydrographs have a short lag time, steep rising limb, and high peak discharge. This means water reaches the river channel quickly, increasing the risk of flash flooding.
Subdued hydrographs, in contrast, have a long lag time, gentle rising limb, and lower peak discharge. These tend to occur in areas with high infiltration, dense vegetation, or permeable geology, reducing flood risk.
Flashy hydrographs are typically associated with urban or deforested catchments, while subdued ones are more common in rural or forested areas.
Antecedent conditions refer to the state of the ground before a rainfall event.
If the ground is already saturated from previous rain, infiltration rates are low, leading to rapid surface runoff and a steeper hydrograph.
Dry or frozen soils can also reduce infiltration, increasing overland flow. Conversely, dry but porous soils may absorb more water initially, delaying runoff and flattening the hydrograph.
These conditions significantly influence the lag time and peak discharge.
The shape of a drainage basin affects how quickly water is delivered to the river channel.
Circular catchments: Water tends to arrive at the channel simultaneously from all directions, producing a shorter lag time and a sharper peak.
Elongated catchments: Water takes longer to converge on the main channel, resulting in a longer lag time and a more gradual hydrograph.
Thus, circular basins are more likely to produce flashy hydrographs, while elongated basins tend to show subdued responses.
Drainage density refers to the total length of streams per unit area of the basin.
High drainage density means more channels are available to carry water, resulting in quicker runoff and a flashier hydrograph.
Low drainage density slows the movement of water to the main channel, producing a longer lag time.
Stream order also matters. Basins dominated by low-order (smaller) streams may respond quickly to rainfall, especially in upland areas.
Hydrographs from the same basin can vary due to changes in weather, land use, or seasonal vegetation.
Seasonal changes: Vegetation cover, evapotranspiration rates, and temperature affect infiltration and runoff.
Human activity: Construction, deforestation, or improved drainage infrastructure alter water flow pathways.
Storm intensity and duration: Different rainfall characteristics lead to varying responses even within the same system.
These variations show that hydrographs are dynamic and influenced by both permanent and temporary factors.
