In this section, the calculations involving a normally distributed variable, denoted as , where is the mean and is the variance, will be explored in-depth. This exploration includes calculating probabilities, deriving relationships between variables, and the standardization process.
Basics of Normal Distribution
- Normal distribution is a bell-shaped curve reflecting a continuous probability distribution.
- Symmetry and Mean: The curve is symmetric around the mean, showing that values near the mean are more common.
- Standard Deviation : Determines the distribution's spread. A larger means a wider spread.
- Real-World Examples: Common in heights, test scores, and measurement errors.
Probability Calculations in Normal Distribution
- Calculating Probabilities: Focuses on the area under the curve.
- Standard Normal Distribution Table: Shows the probability of a standard normal variable being within a range. It lists probabilities for values less than a given -score.
Example Problems
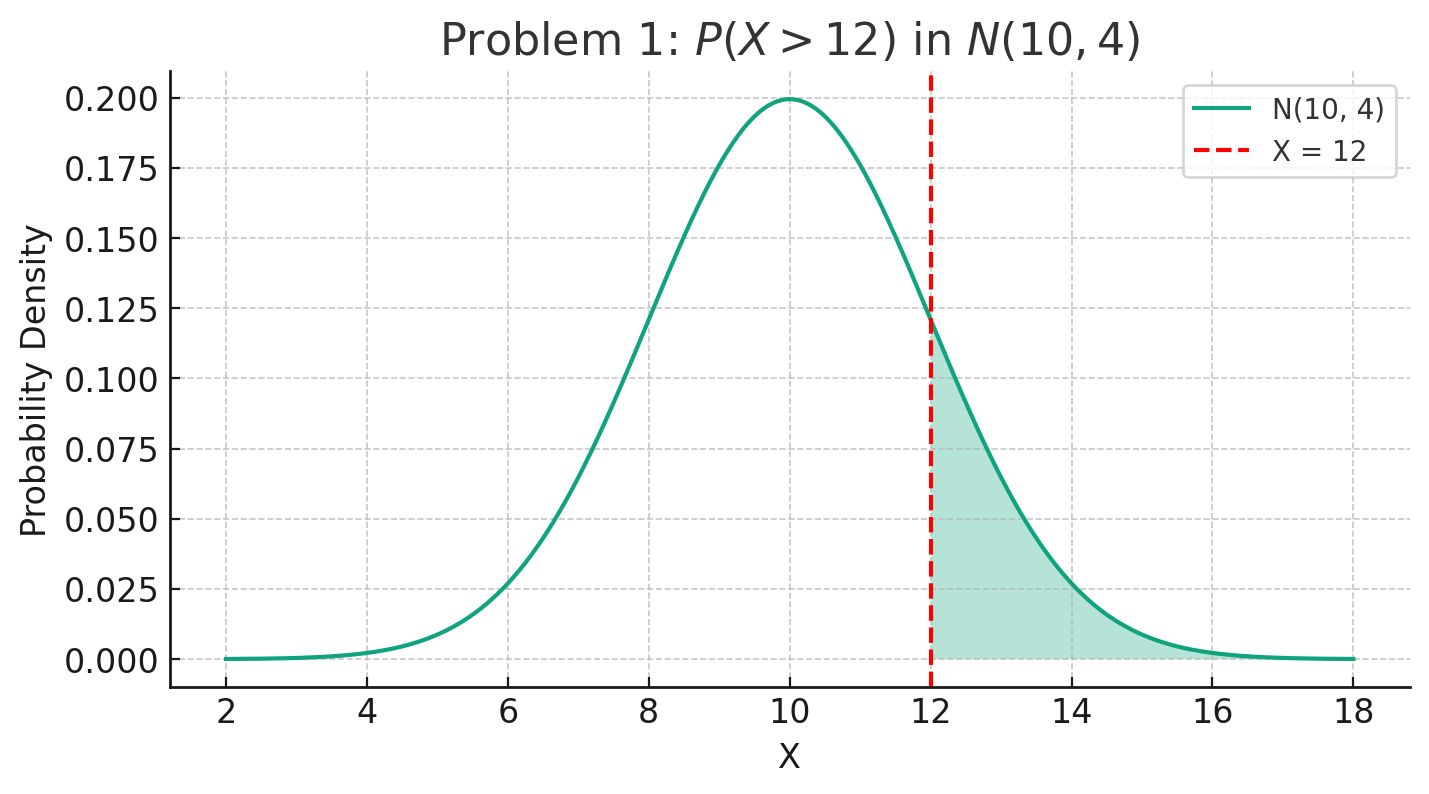
Example 1: Finding Probability
- Standardize the Variable: Convert to using . . For .
- Calculate Probability: Find . This means , or a 15.87% chance will be greater than 12.
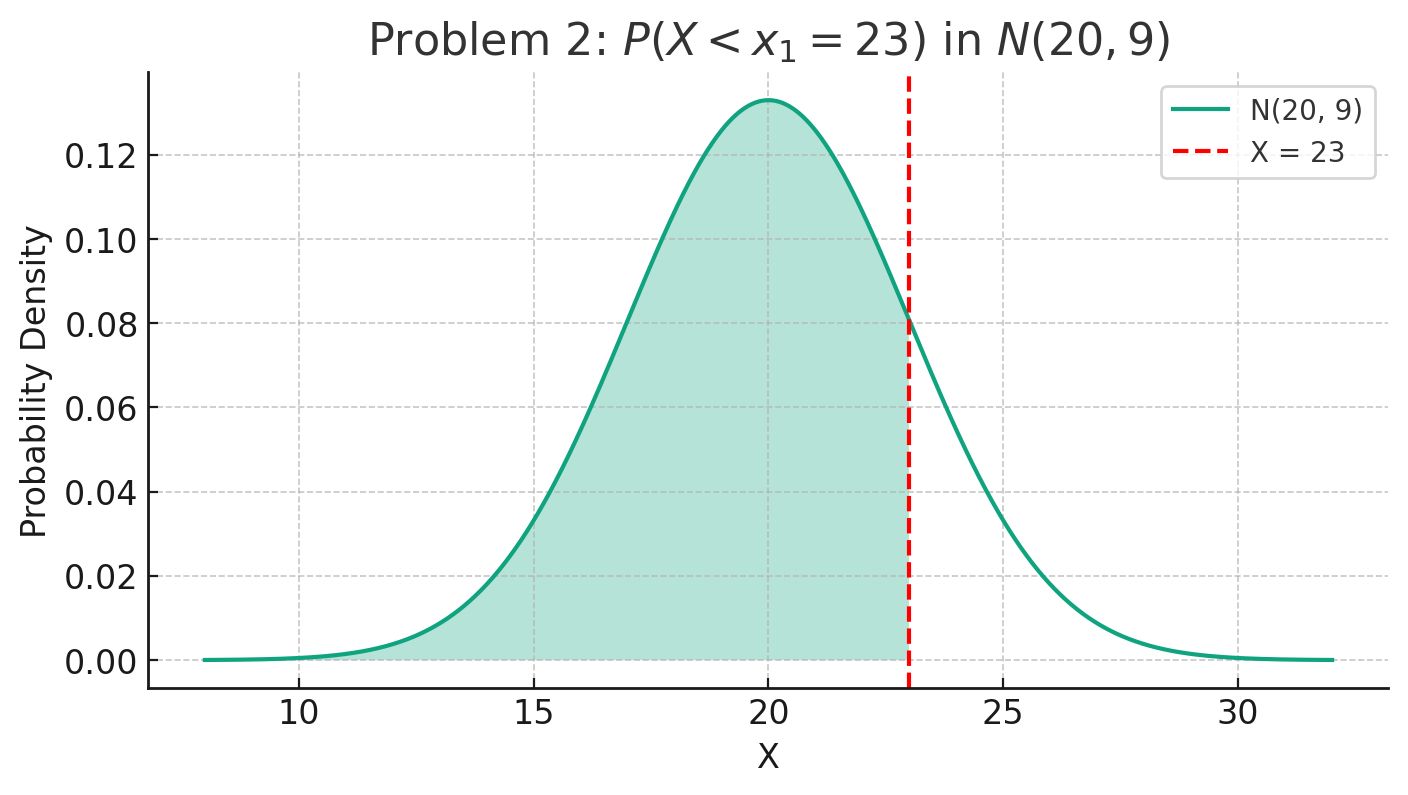
Example 2: Deriving Value of
- Find the -Score: For , -score is about 1.00.
- Calculate : Using , find . There's an 84.13% chance will be less than 23.
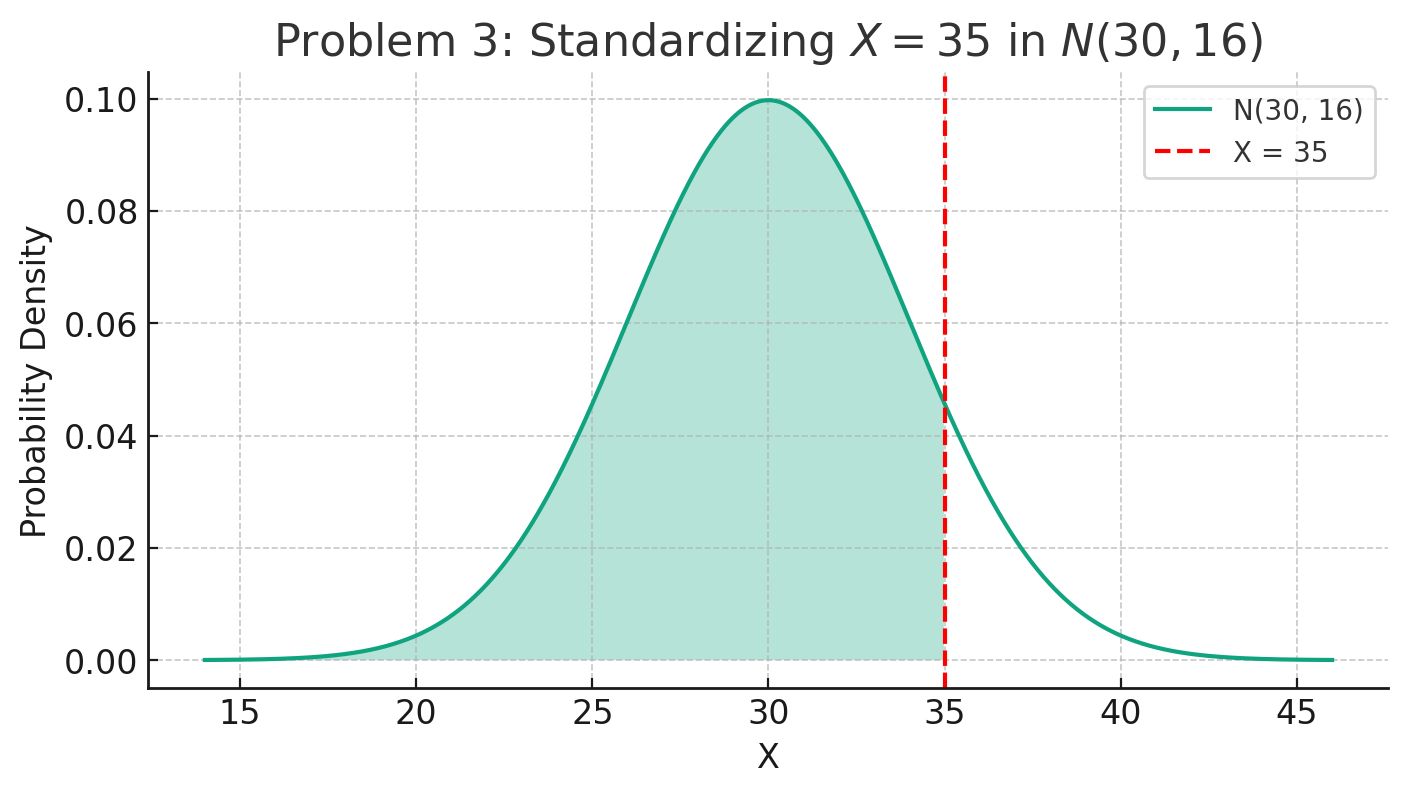
Example 3: Standardizing a Normal Variable
- Calculate the -Score: For in , .
- Graphical Representation: Shows is standard deviations above the mean of 30.