
Edexcel Specification focus:
‘Prediction and forecasting accuracy varies by hazard type and location; scientists play an important role.’
Introduction:
Forecasting tectonic hazards helps reduce risk. Scientists use different methods to predict earthquakes, volcanic eruptions and tsunamis with varying levels of success.
Forecasting and Predicting Tectonic Events
The Role of Prediction and Forecasting
Prediction refers to providing a specific time, location, and magnitude of a tectonic event, while forecasting gives probabilistic assessments over a timeframe. For tectonic hazards, exact prediction remains difficult, but forecasting is more achievable.
Scientists play an important role in both forecasting and mitigating the risks associated with tectonic hazards. Their contributions involve monitoring, modelling and communicating risk based on geophysical evidence.
Earthquake Forecasting
Forecasting earthquakes is the most uncertain among tectonic hazards due to the complex nature of crustal stress and fault behaviour.
Seismic Gap: A segment of an active fault known to produce earthquakes that has not slipped in an unusually long time compared to other segments.
Why Earthquake Prediction Is Difficult
Earthquakes often occur without clear precursors.
Stress builds gradually, but release is sudden and hard to track.
Fault systems are complex and subsurface processes are hard to observe directly.
Methods Used in Earthquake Forecasting
Seismic monitoring: Measures small foreshocks and tremors, but these do not always lead to major events.
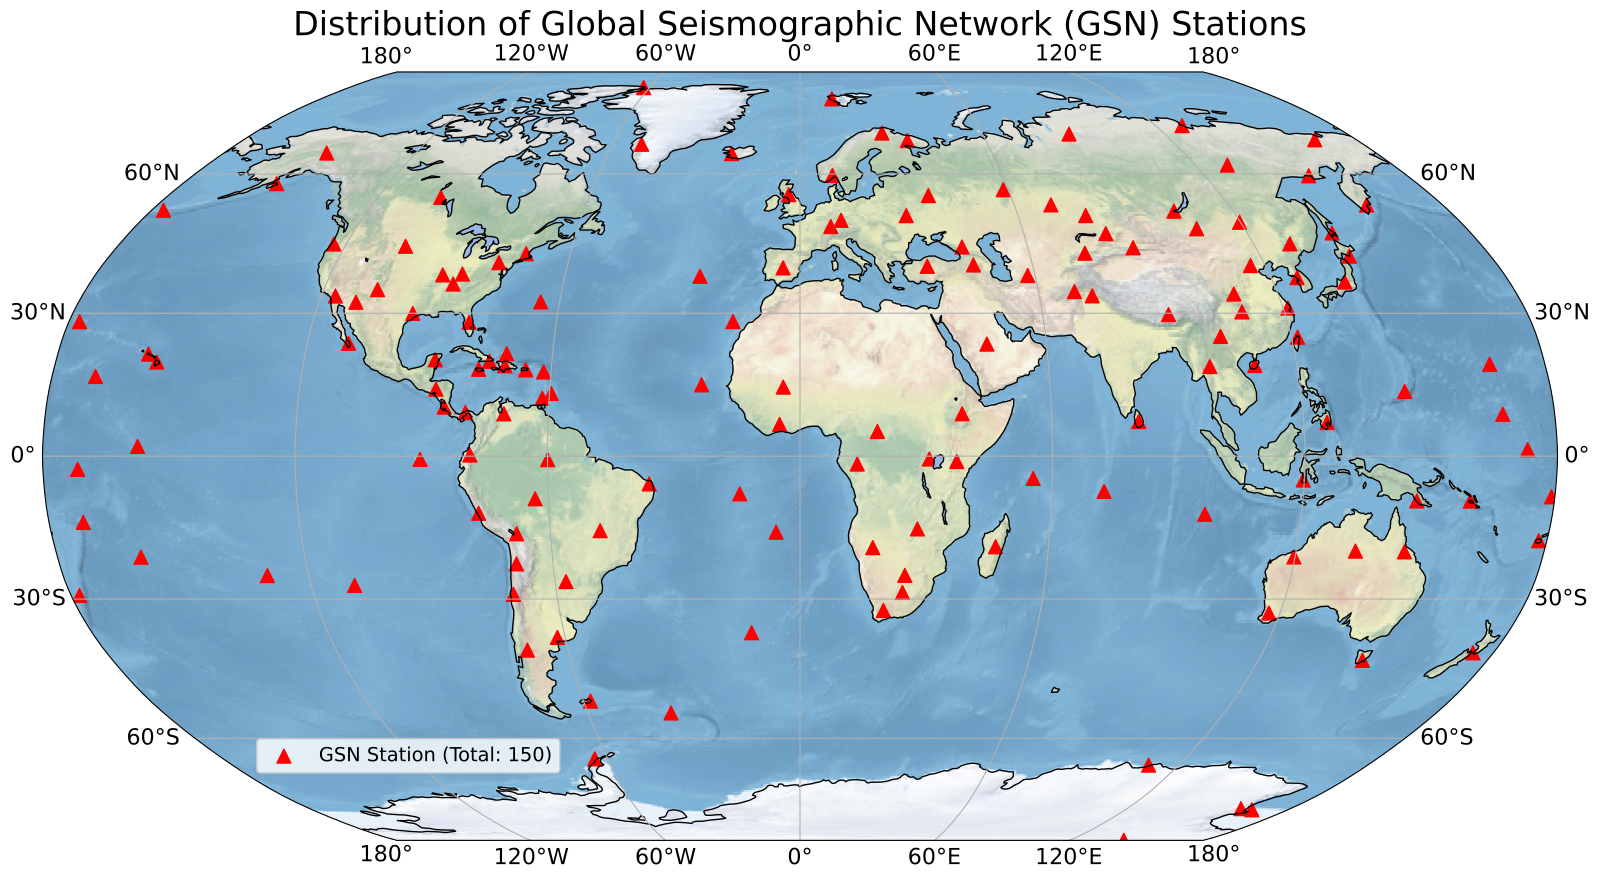
A global map showing the locations of permanent seismometer stations in the Global Seismic Network, used to detect and locate earthquakes in real time. source
Strain meters and GPS: Detect crustal deformation, which may indicate accumulating stress.
Historical records and recurrence intervals: Used to identify patterns over time, especially along major faults.
Seismic gap theory: Suggests that segments of faults that haven’t slipped in a long time are more likely to experience a large earthquake.
Despite these efforts, reliable short-term prediction remains scientifically elusive. Earthquake forecasting is typically probabilistic—stating the likelihood of an event within a given time period.
Volcanic Eruption Forecasting
Volcanic eruptions are more amenable to prediction due to the detectable physical changes that often precede them.
Volcano Monitoring: The observation and measurement of volcano-related parameters to detect signs of an impending eruption.
Techniques Used in Volcano Forecasting
Seismology: Earthquake swarms beneath a volcano indicate magma movement.
Ground deformation: Tiltmeters and GPS detect swelling caused by rising magma.
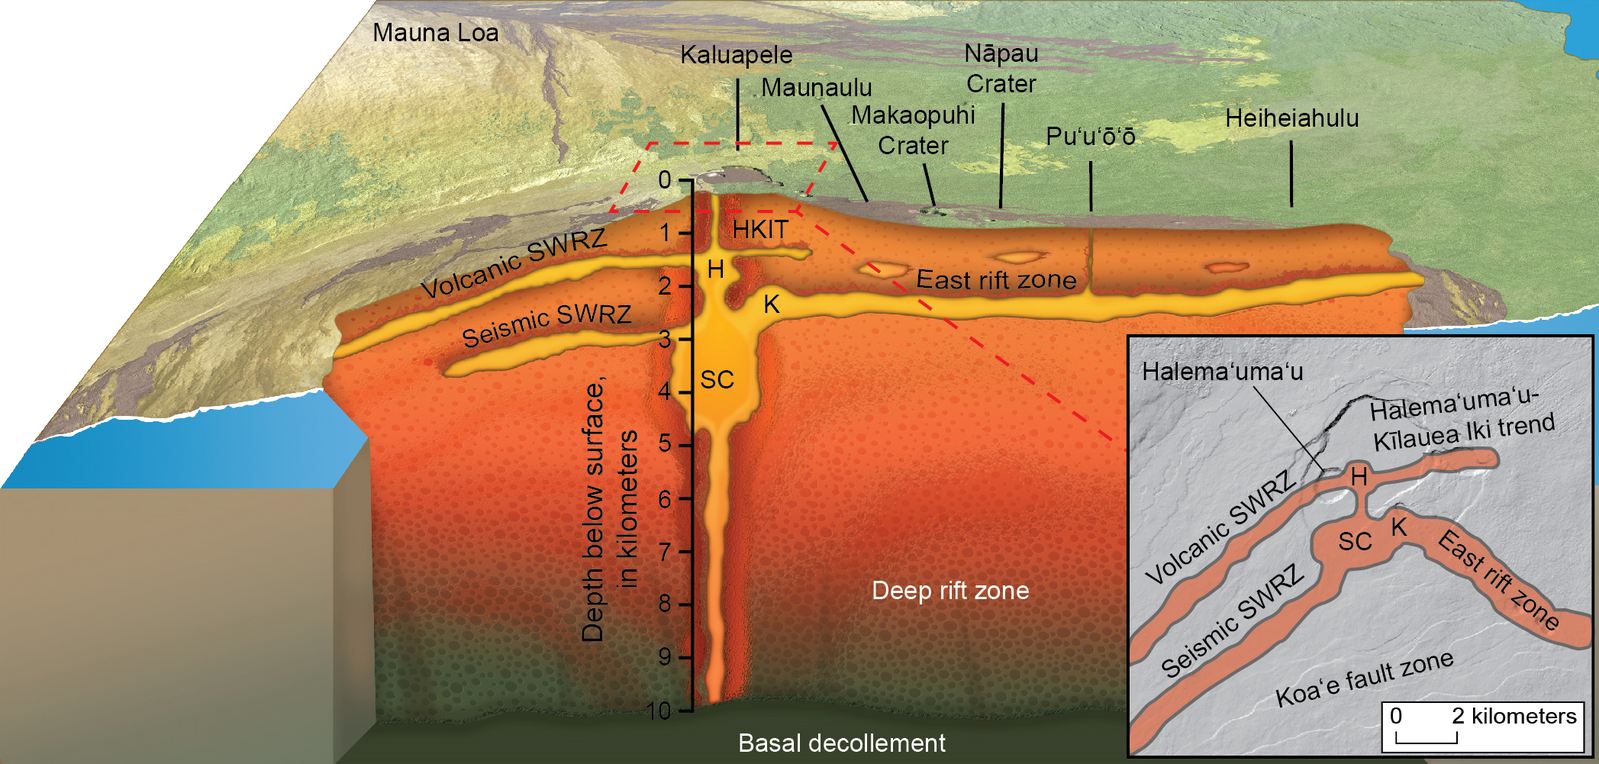
A cross-section of Kīlauea’s subsurface magma plumbing system, showing reservoirs and dikes whose inflation and deflation are monitored to forecast eruptions. source
Gas emissions: Increased levels of gases such as sulphur dioxide (SO₂) can suggest magma nearing the surface.
Thermal imaging: Detects heat anomalies in the ground or crater areas.
Remote sensing: Satellites provide broad coverage of thermal, gas and ground changes.
These techniques allow scientists to develop eruption forecasts with reasonable accuracy, often providing days to weeks of warning, enabling evacuations and hazard preparations.
Tsunami Forecasting
Tsunamis are generally caused by undersea earthquakes at subduction zones, where one tectonic plate is forced under another. These events cause sudden vertical displacement of the sea floor, leading to wave generation.
Tsunami: A series of large sea waves generated by the displacement of the sea bed due to undersea earthquakes, volcanic eruptions, or landslides.
Tsunami Prediction and Early Warning Systems
Although tsunamis cannot be predicted in advance of the triggering earthquake, early warning systems can detect them rapidly after they form.
Seismometers: Identify undersea earthquakes and assess whether they are likely to generate tsunamis.
DART buoys (Deep-ocean Assessment and Reporting of Tsunamis): Measure pressure changes in the ocean to detect tsunami waves.
Tsunami Warning Centres: Analyse data and issue alerts to vulnerable coastlines within minutes of detection.
These systems are especially effective in the Pacific and Indian Oceans, though their success depends on communication speed, public awareness, and infrastructure readiness.
Accuracy Variation by Hazard Type
The accuracy of prediction and forecasting varies widely:
Earthquakes: Poor short-term predictability; long-term forecasts possible for high-risk zones.
Volcanoes: Good short-term forecasting due to observable precursors.
Tsunamis: Prediction limited to post-earthquake detection; early warning systems can mitigate impact if implemented effectively.
The Importance of Location and Context
Geographical location plays a major role in forecasting effectiveness:
Some regions are well-monitored (e.g. Japan, USA), while others lack infrastructure (e.g. many developing countries).
Local geology affects the type and frequency of hazards—e.g. fast-moving subduction zones vs. stable continental interiors.
Additionally, population density, economic development and governance influence how well forecasting systems are implemented and how communities respond.
Scientific Contributions and Limitations
Scientists contribute by:
Developing models of tectonic behaviour.
Installing and maintaining monitoring equipment.
Collaborating internationally on hazard forecasting systems.
Educating governments and the public.
However, limitations include:
Incomplete data in remote or poorly monitored regions.
Uncertainty in interpreting signals, particularly for earthquakes.
Financial and political constraints affecting monitoring and response.
Despite these challenges, scientific forecasting remains a critical tool in risk reduction and disaster preparedness.
Practice Questions
Question 1 (2 marks):
Explain why volcanic eruptions are generally easier to forecast than earthquakes.
Mark Scheme:
1 mark for identifying that volcanic eruptions often have observable warning signs (e.g. ground deformation, gas emissions).
1 mark for stating that earthquakes typically occur without clear precursors or warning.
(Maximum 2 marks)
Question 2 (6 marks):
Assess the extent to which the effectiveness of tsunami forecasting depends on the location of the hazard.
Mark Scheme:
1 mark for recognising that some locations have better monitoring infrastructure (e.g. Pacific Ocean countries with DART systems).
1 mark for noting that less developed regions may lack early warning systems or rapid communication infrastructure.
1 mark for explaining the role of physical geography, such as distance from epicentre or coastal shape.
1 mark for reference to time available to respond depending on proximity to subduction zones.
1 mark for supporting the answer with a relevant example (e.g. 2004 Indian Ocean tsunami or 2011 Japan).
1 mark for making a reasoned judgement on the extent to which location affects forecasting success.
(Maximum 6 marks)
FAQ
Probabilistic forecasts use long-term data on fault activity, historical seismicity, and stress accumulation to estimate the likelihood of earthquakes occurring over specific time frames.
These forecasts do not predict exact dates or magnitudes but express risk as percentages. For example, a region may have a 30% chance of a magnitude 6.0+ earthquake in the next 20 years.
They inform building codes, land-use planning, and insurance models by identifying high-risk zones and encouraging hazard-resilient development.
GPS networks track the slow movement of the Earth’s crust with millimetre precision. This is crucial for:
Detecting strain accumulation on fault lines
Monitoring ground deformation around volcanoesIdentifying post-seismic adjustments after earthquakes
High-frequency GPS stations allow real-time data collection, improving early warnings and supporting evacuation decisions in tectonically active zones.
Gas emissions, especially sulphur dioxide (SO₂), can indicate rising magma, but interpreting them can be difficult due to:
Wind and weather conditions dispersing gases unpredictably
Background emissions from dormant or non-eruptive activity
Rapid changes in gas composition not always leading to eruptions
To be reliable, gas monitoring is combined with seismic and deformation data to reduce false alarms and improve accuracy.
DART buoys and seafloor sensors transmit data to national or international warning centres via satellite communications.
When a seismic event occurs:
Sensors detect sea-level pressure changes
Buoys send data to satellites
Data is relayed to warning centres within minutes
Alerts are issued to at-risk coastlines via sirens, TV, mobile apps and radio
The system's success relies on fast data processing and public preparedness for immediate action.
Tectonic processes cross national borders, so global cooperation is essential. Key contributions include:
Shared access to real-time seismic and GPS data
Coordinated early warning systems for tsunamis (e.g. UNESCO’s IOC)
Joint training and funding for hazard monitoring in low-resource areas
Collaborative research on improving models and forecasting tools
These partnerships enhance the reliability and reach of hazard forecasting worldwide.
