
IB Syllabus focus:
‘Storages are boxes; flows are arrows showing energy and matter inputs/outputs. Box and arrow sizes can represent storage and flow magnitudes.’
Understanding storages and flows is central to system thinking in Environmental Systems and Societies. By representing them in system diagrams, students can visualise how energy and matter circulate.
Storages in Systems
Storages represent the quantities of energy or matter held within a system at any given time. They are shown as boxes in system diagrams.
Storage: A quantity of energy or matter contained within a system at a specific point in time.
Examples of storages include:
Biomass in a forest ecosystem.
Carbon dioxide in the atmosphere.
Water in a lake or reservoir.
Storages are dynamic rather than static, as their size changes depending on the balance between inputs and outputs.
Flows in Systems
Flows illustrate the movement of energy or matter between storages or across system boundaries. They are represented as arrows in system diagrams.
Flow: The transfer of energy or matter between storages within a system, or between the system and its environment.
There are two main categories of flows:
Inputs: Flows entering a storage (e.g., rainfall into a river, energy from sunlight).
Outputs: Flows leaving a storage (e.g., evaporation from a lake, carbon dioxide release from respiration).
Flows have direction and magnitude, making them essential for understanding system processes.
Visual Representation: Boxes and Arrows
System diagrams use boxes and arrows to depict storages and flows.
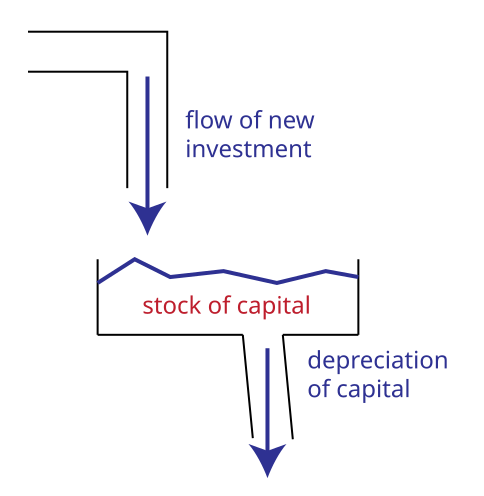
An abstract stock–flow diagram illustrating a storage (box) with inflow and outflow arrows. Use it as a visual key for interpreting environmental system diagrams elsewhere in the notes. This figure contains no extra content beyond the syllabus convention. Source.
Boxes: Represent the size of a storage. The larger the box, the greater the amount stored.
Arrows: Represent flows between storages. The thickness of the arrow indicates the magnitude of the flow.
This allows students to compare processes visually, identifying which storages dominate or which flows are most significant.
Energy and Matter Movement
System diagrams track both energy and matter. Although energy and matter behave differently, both are essential to environmental system modelling.
Energy flows: Usually one-way, as energy eventually degrades to heat and is lost to the system. For example, solar energy enters ecosystems through photosynthesis and is passed through trophic levels.
Matter flows: Typically cyclical, as matter is recycled through processes like the carbon, nitrogen, and water cycles.
Matter Flow: The cyclical movement of matter through storages within a system.
Energy flow is limited in time and space, while matter is conserved and reused.
The Importance of Magnitude
The IB specification emphasises that the sizes of boxes and arrows can represent magnitudes. This provides an extra layer of information within system diagrams.
Larger boxes = bigger storages (e.g., the ocean as the largest carbon sink).
Thicker arrows = stronger flows (e.g., high rates of transpiration in rainforests).
This proportionality helps highlight imbalances. For instance, if outputs exceed inputs, storages will decrease, potentially destabilising the system.
Application in Environmental Systems
System diagrams are widely applied in ESS to clarify relationships:
Carbon cycle: Shows how carbon is stored in biomass, oceans, and atmosphere, and how it flows through respiration, photosynthesis, combustion, and diffusion.
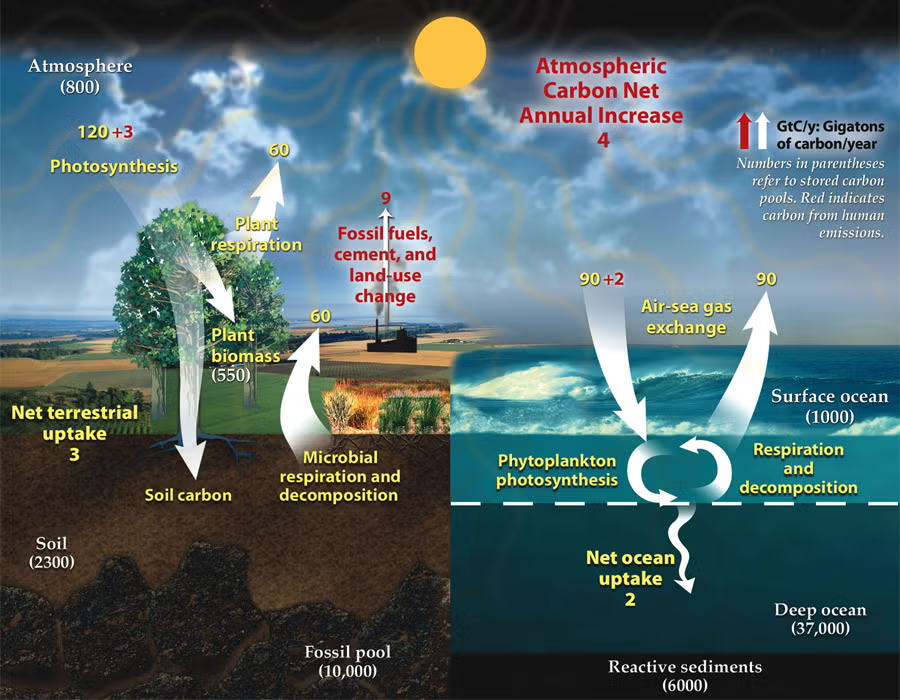
A carbon cycle systems diagram identifying major carbon storages and directional flows; arrow thickness communicates relative magnitude of fluxes. Numerical labels (GtC and GtC yr⁻¹) extend beyond the syllabus requirement but help students interpret magnitude representation in system diagrams. Use qualitatively for structure and proportionality rather than for memorising specific numbers. Source.
Water cycle: Storages include lakes, oceans, and ice, while flows include evaporation, condensation, and precipitation.
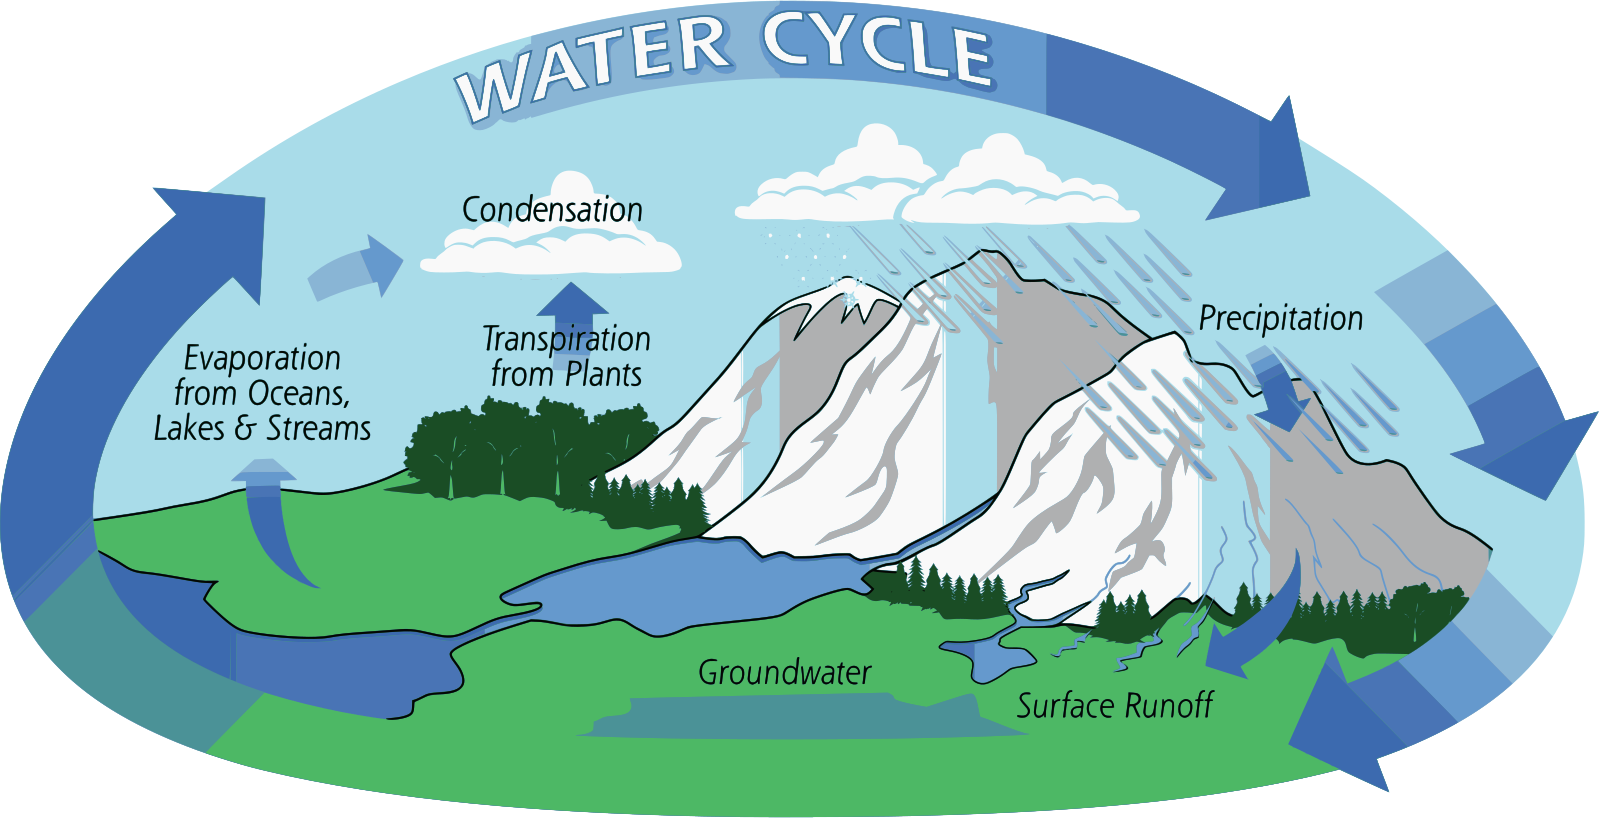
A high-resolution water cycle diagram showing key storages and directional flows of water through the Earth system. Labels identify processes such as evaporation, condensation, and precipitation; this aligns with using arrows for flows between storages. The diagram includes additional labels like runoff and transpiration, which are useful context but not required by the syllabus statement. Source.
Energy flow in ecosystems: Solar energy stored in plants flows through herbivores and carnivores, with heat lost at each step.
These models assist in identifying points of human impact, such as deforestation altering carbon storages or dams interrupting water flows.
System Diagrams as Models
System diagrams are simplifications of reality but provide crucial insights:
They highlight relationships between components rather than isolated elements.
They allow for comparisons across different ecosystems or scenarios.
They support predictions of how changes to one component might affect the whole system.
System Diagram: A simplified visual model using boxes and arrows to represent storages and flows within a system.
While useful, these diagrams omit detail and assume linearity, which may not reflect the complexity of natural systems.
Limitations of Representation
Despite their effectiveness, system diagrams have limitations:
Oversimplification: Complex interactions may be ignored.
Static portrayal: Diagrams often show a single snapshot rather than changes over time.
Uncertainty of magnitude: Real data on flow sizes and storage amounts can be incomplete or estimated.
These limitations mean system diagrams are best viewed as tools for understanding rather than perfect reflections of reality.
Summary Points for Students
To ensure clarity, remember:
Storages are boxes, representing amounts of energy or matter.
Flows are arrows, representing movements into or out of storages.
The size of boxes and thickness of arrows indicate magnitude.
Energy flows are mostly one-way, while matter flows are cyclical.
System diagrams are simplifications but highly valuable in identifying relationships and impacts within environmental systems.
Practice Questions
Question 1 (2 marks)
Identify what the boxes and arrows represent in a system diagram used in Environmental Systems and Societies.
Mark scheme:
1 mark for stating that boxes represent storages of energy or matter.
1 mark for stating that arrows represent flows of energy or matter into, out of, or between storages.
Question 2 (5 marks)
Using the example of either the carbon cycle or the water cycle, explain how storages and flows are represented in a system diagram and describe how the size of boxes and the thickness of arrows can illustrate magnitudes.
Mark scheme:
1 mark for naming a correct cycle (carbon or water).
1 mark for identifying at least two storages (e.g., atmosphere, ocean, biomass, lakes, ice).
1 mark for identifying at least two flows (e.g., photosynthesis, respiration, evaporation, precipitation).
1 mark for explaining that the size of boxes represents the relative size of storages.
1 mark for explaining that the thickness of arrows represents the relative magnitude of flows.
FAQ
Storages in living systems include components such as biomass in plants or animals, where energy and matter are actively cycled through growth, respiration, and decay.
Storages in non-living systems, such as soil, atmosphere, or oceans, can hold much larger quantities of matter or energy over longer timescales and often act as long-term reservoirs.
By visually comparing storages and flows, system diagrams make it easier to identify where human activities alter natural processes.
Examples include:
Deforestation reducing biomass storage.
Burning fossil fuels increasing carbon flow to the atmosphere.
Dams interrupting water flows in river systems.
Without proportionality, diagrams risk misrepresenting the importance of certain flows or storages.
Thicker arrows and larger boxes help convey which components dominate the system, such as the ocean as a major carbon sink or transpiration as a key water flow. This visual scaling aids in recognising imbalances and potential vulnerabilities.
In open systems, flows involve both matter and energy crossing the system boundary, such as rivers exchanging water, sediments, and energy with their surroundings.
In closed systems, only energy crosses the boundary, meaning matter remains contained. Earth is often considered a closed system for matter but open for energy, as solar radiation enters and heat exits.
Measuring storages often requires sampling across large or inaccessible areas, such as estimating global biomass or deep-ocean carbon.
Flows can be even harder to quantify, as they depend on rates of processes like photosynthesis, respiration, or evaporation, which vary seasonally and spatially.
As a result, many values used in system diagrams are estimates or averages, introducing uncertainty into representations.
