
IB Syllabus focus:
‘Models simplify reality to explain function and predict responses (graphs, diagrams, equations, simulations, descriptions). Simplification brings approximation and potential inaccuracy; predictions depend on assumptions; lab models may poorly represent natural ecosystems.’
Models are essential in Environmental Systems and Societies as they provide structured ways to represent complex systems. They help simplify ecological, social, and environmental processes to enhance understanding.
The Role of Models in Environmental Systems
Simplifying Complexity
Environmental systems are vast, dynamic, and interconnected. Models act as simplified representations, highlighting key relationships while leaving out overwhelming detail. This enables students, scientists, and policymakers to focus on essential interactions and outcomes.
Model: A simplified representation of a system or process, designed to explain its functioning and predict potential responses to changes.
Models make it possible to study scenarios that would otherwise be impossible, too costly, or too dangerous to test in reality, such as large-scale climate shifts or pollution dispersal.
Uses of Models
Predictive Tools
Models are valuable in forecasting environmental responses to different variables, such as predicting the impacts of deforestation on carbon storage or assessing the outcomes of conservation strategies.
Communication Tools
By simplifying information, models communicate ideas to diverse audiences, from policymakers to students. A well-designed diagram or graph can convey concepts more clearly than text alone.
Decision-Making Aids
Models allow governments and organisations to evaluate potential strategies before implementation. For example:
Predicting the effect of legislation on emissions.
Simulating outcomes of introducing renewable energy systems.
Assessing ecological consequences of urban development.
Testing Hypotheses
Models allow researchers to test predictions, compare scenarios, and refine theories. They are essential in developing and revising scientific understanding.
Forms of Models
Graphs
Graphs visually show relationships between variables. Examples include:
Population growth curves.
Climate change projections.
Energy flow diagrams.
Diagrams
Simplified visual representations that map storages and flows. System diagrams show how energy and matter move within ecosystems.
Equations
Mathematical models quantify relationships between variables.
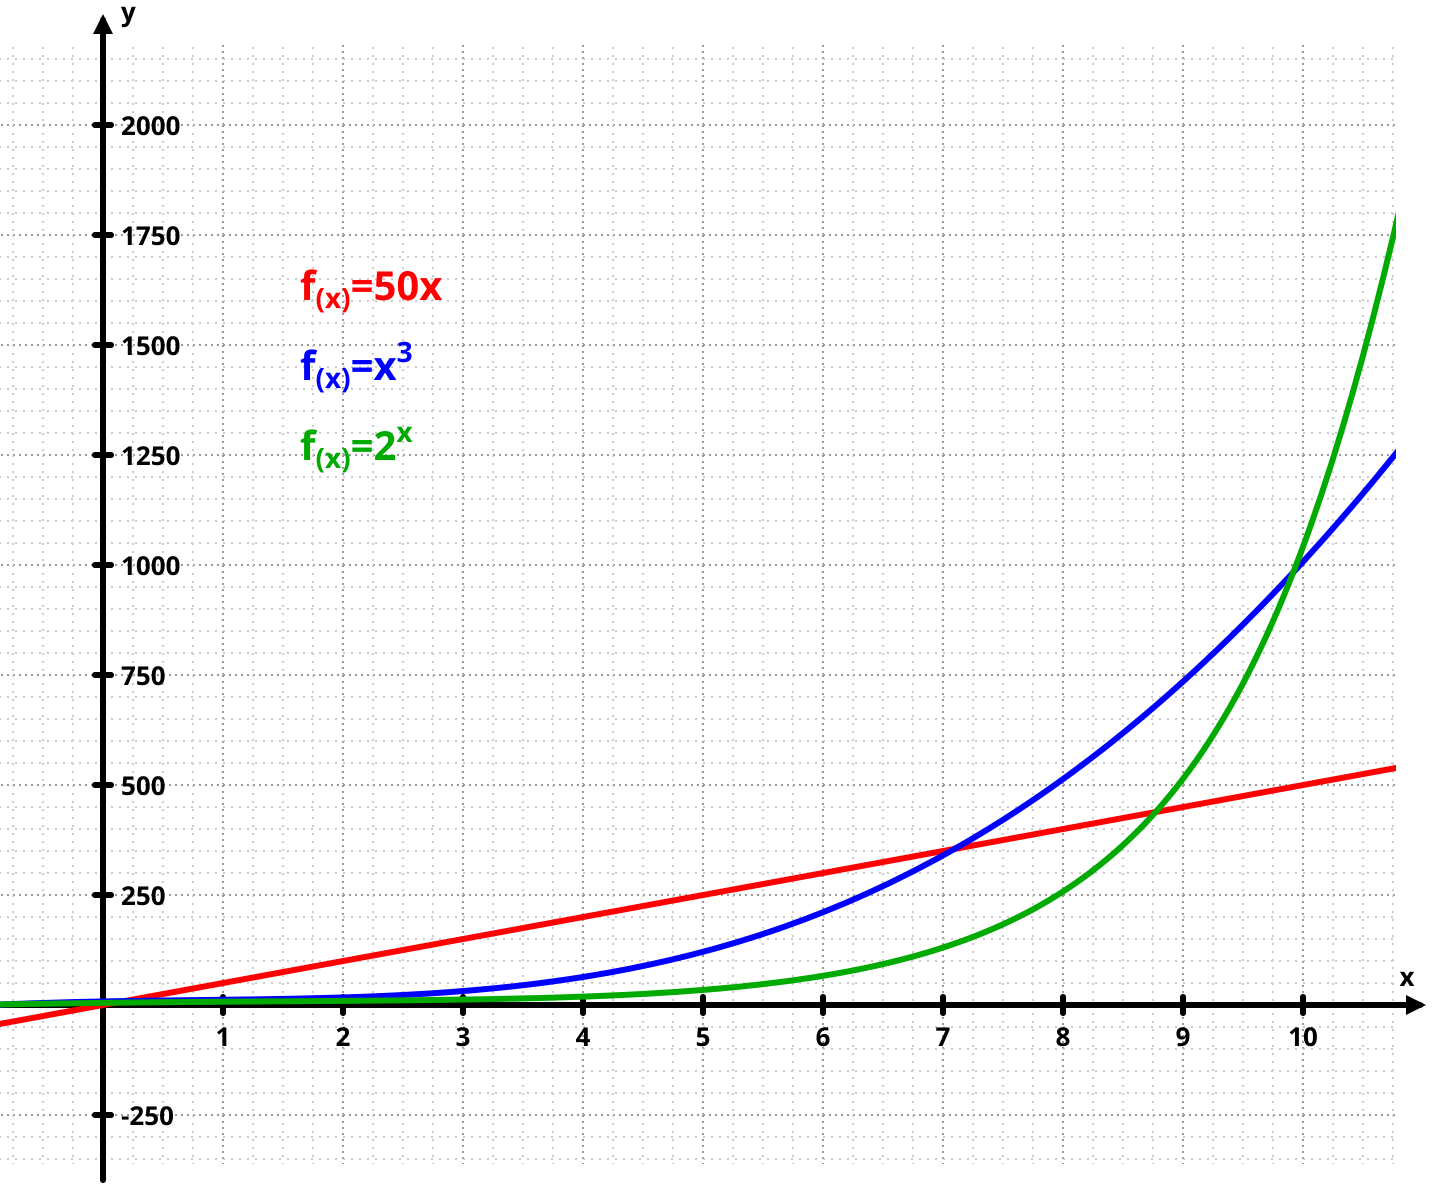
This figure contrasts exponential growth with linear and power functions to show how different mathematical models represent change over time. The exponential curve is the appropriate model when growth rate is proportional to current size (as introduced in your notes). Extra detail: linear and power curves are included for comparison only. Source.
Population Growth (dN/dt) = rN
dN/dt = rate of population change
r = intrinsic growth rate
N = population size
This equation helps predict population trends under specific conditions.
Simulations
Computer simulations replicate scenarios under different assumptions. They allow large-scale analysis of climate patterns, atmospheric circulation, or pollution dispersal.
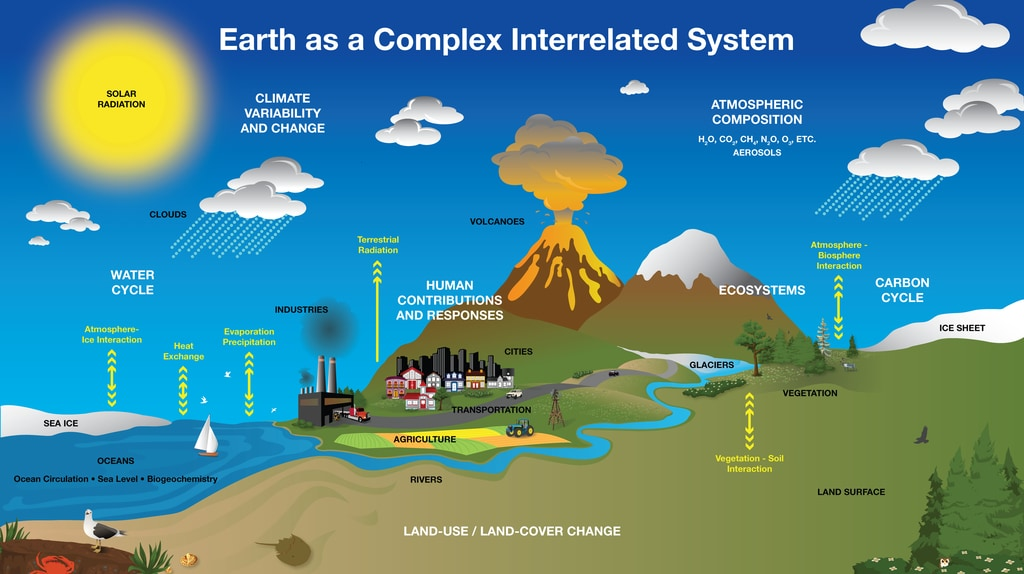
This diagram presents interacting components of the Earth system (atmosphere, ocean, land, ice, and biosphere), the kind of coupled processes represented in climate simulations. It exemplifies how models integrate subsystems to study responses to natural and human drivers. Source.
Descriptions
Sometimes, verbal or written models describe processes without mathematical or graphical representation. These are useful in qualitative discussions, such as explaining feedback mechanisms.
Strengths of Models
Clarity: They reduce overwhelming detail into understandable forms.
Accessibility: Models allow both experts and the general public to engage with environmental issues.
Comparability: Different scenarios can be compared easily.
Practicality: They can be used when real-life experiments are not feasible.
Limitations of Models
Simplification
Every model leaves out details. While this makes systems manageable, it also introduces approximations.
Dependence on Assumptions
The accuracy of predictions depends on the assumptions built into the model. If assumptions are unrealistic, predictions may mislead.
Scale Problems
Laboratory models often fail to represent the complexity of natural ecosystems. For instance, small-scale models cannot fully replicate global processes like climate change.
Risk of Misinterpretation
Non-specialists may treat models as reality rather than simplifications, leading to flawed decisions.
Changing Systems
Environmental systems are dynamic. A model may become outdated quickly as new variables emerge, such as new pollutants or unforeseen ecological interactions.
Case of Model Uncertainty
Models of climate change highlight both usefulness and limitation:
They predict global warming trends with strong confidence.
Yet, they vary in projecting regional rainfall or local impacts due to limited data and complex interactions.
This demonstrates how models are powerful guides but not perfect predictions.
Key Takeaways
When using models in Environmental Systems and Societies:
Recognise them as simplified tools for understanding and predicting.
Appreciate their forms: graphs, diagrams, equations, simulations, descriptions.
Remember their limits: approximations, dependence on assumptions, and imperfect representation of natural complexity.
Models are central to environmental decision-making, but their outputs should always be interpreted cautiously, with awareness of their assumptions and simplifications.

This ecosystem diagram models energy flows across trophic levels using labelled arrows and tiers, demonstrating how diagrams simplify storages and transfers in a system. It supports the use of diagrams to represent flows of matter and energy as discussed in your notes. Source.
Practice Questions
Question 1 (2 marks)
State two different forms of models used in Environmental Systems and Societies and briefly describe their purpose.
Mark scheme:
1 mark for correctly naming each form of model (max 2 marks).
Acceptable answers include: graphs, diagrams, equations, simulations, descriptions.
Award full marks only if each form is accompanied by a brief purpose, e.g., “Graphs show relationships between variables such as population growth” or “Simulations allow testing of scenarios like climate change patterns.”
Question 2 (5 marks)
Discuss the limitations of using models in Environmental Systems and Societies, with reference to why simplification and assumptions can affect their reliability.
Mark scheme:
Up to 2 marks for describing simplification (e.g., omits detail, creates approximations).
Up to 2 marks for explaining assumptions (e.g., accuracy depends on assumptions made; unrealistic assumptions may mislead predictions).
1 mark for at least one additional limitation (e.g., scale issues with laboratory models, misinterpretation by non-specialists, or outdated data).
Maximum of 5 marks.
Answers must provide explanation, not just a list, to reach higher mark levels.
FAQ
Real-world environmental experiments can be costly, time-consuming, or ethically impossible, such as altering climate or ecosystems. Models provide safe, manageable alternatives.
They allow researchers to test scenarios quickly, compare different outcomes, and explore impacts without causing harm. Models also enable long-term projections that would not be feasible in practical experiments.
Reliability depends on:
Quality and accuracy of input data.
The validity of assumptions underlying the model.
How well the model’s predictions match observed reality.
Peer review and replication by other scientists.
A model’s reliability improves when it is continually updated with new evidence and adjusted for known limitations.
Graphs and diagrams usually represent relationships or flows visually, without processing change over time.
Simulations, however, use algorithms to replicate system behaviour under changing conditions. They can include multiple variables, feedback loops, and scenario testing. This makes simulations more powerful for prediction but also more prone to error if assumptions are weak.
Policymakers may misinterpret models as exact forecasts rather than approximations.
This can occur if:
They overlook assumptions and uncertainties.
They select results that support a political agenda.
They ignore limitations in scale or scope.
Proper communication of a model’s purpose and constraints is essential to avoid misuse.
Global systems involve countless variables and interactions, making simplification more problematic.
Emergent challenges include:
Uncertainty in representing feedback loops.
Difficulties in scaling local data to global models.
Rapidly changing human behaviour altering outcomes faster than models can adjust.
These challenges mean that global environmental models are highly useful but must be interpreted with caution.
