
IB Syllabus focus:
‘Use indicators (biodiversity, pollution, population, climate, material/carbon). Ecological, carbon, and water footprints compare demand to capacity; unsustainability occurs when footprint exceeds biocapacity. GDP overlooks environmental costs; Green GDP adjusts. Citizen science aids monitoring.’
Indicators, ecological footprints, and biocapacity are key tools for measuring sustainability. They provide evidence-based methods to evaluate human impacts on ecosystems, resources, and long-term viability.
Indicators of Sustainability
Indicators are measurable variables that provide insight into the health and sustainability of socio-ecological systems. They highlight trends, pressures, and responses over time.
Key Environmental Indicators
Biodiversity indicators: Assess species richness, population size, and ecosystem variety. High biodiversity often signals resilience and ecological stability.
Pollution indicators: Measure the concentration of pollutants (air, water, soil), tracking human impact and regulatory effectiveness.
Population indicators: Show demographic changes such as growth rate, density, and age distribution, directly influencing resource consumption.
Climate indicators: Include temperature trends, CO₂ concentration, and extreme weather events, revealing the global impacts of anthropogenic activity.
Material and carbon indicators: Monitor the flow of raw materials and greenhouse gas emissions, central to assessing environmental sustainability.
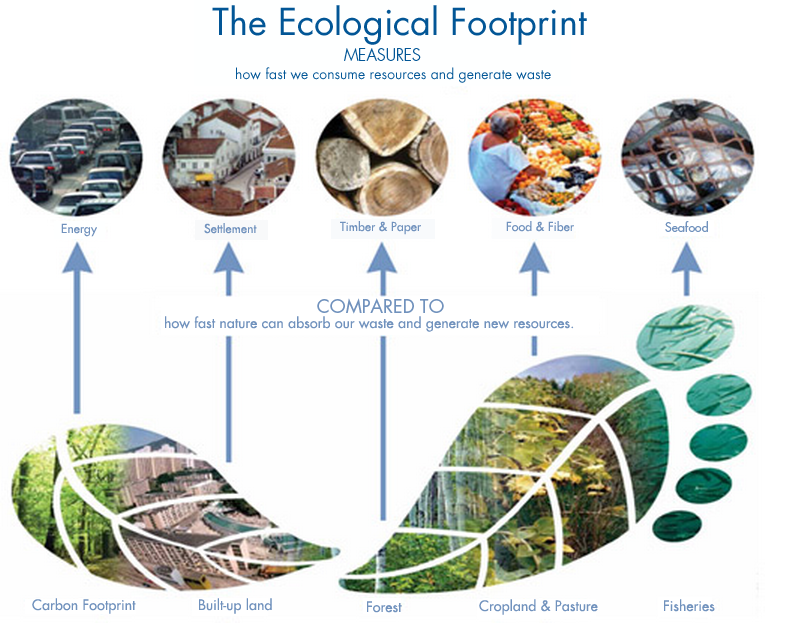
The Ecological Footprint aggregates human demand on bioproductive land and sea into five components—carbon, built-up land, forest, cropland & pasture, and fisheries—then compares that demand to Earth’s capacity to regenerate. Labels link sectoral uses (for example, energy or timber) to the biocapacity they require. This visual aligns with IB ESS expectations for indicator structure and terminology. Source.
Importance of Indicators
They allow comparisons across regions and timescales.
They provide evidence for policy decisions and sustainability planning.
They help identify unsustainable trends before thresholds are crossed.
Ecological Footprints
The ecological footprint is a central metric for sustainability, quantifying human demand on Earth’s ecosystems.
Ecological Footprint: The total area of biologically productive land and water required to provide the resources a population consumes and to absorb its waste, given current technology.
Components of Ecological Footprint
Food production (cropland and pasture)
Timber and fibre production (forest land)
Energy land for CO₂ absorption
Built-up land for infrastructure
Fishing grounds for seafood resources
The ecological footprint provides a single, comparable figure that captures diverse human impacts.
Biocapacity
The concept of biocapacity complements the ecological footprint.
Biocapacity: The capacity of ecosystems to regenerate resources and absorb wastes, measured in global hectares per person.
Biocapacity reflects the supply side of ecological accounting, while ecological footprint represents the demand side.
Relationship Between Footprint and Biocapacity
Sustainable use occurs when footprint ≤ biocapacity.
Unsustainability arises when footprint > biocapacity, creating ecological overshoot.
This mismatch underpins many of today’s environmental crises, from deforestation to climate change.
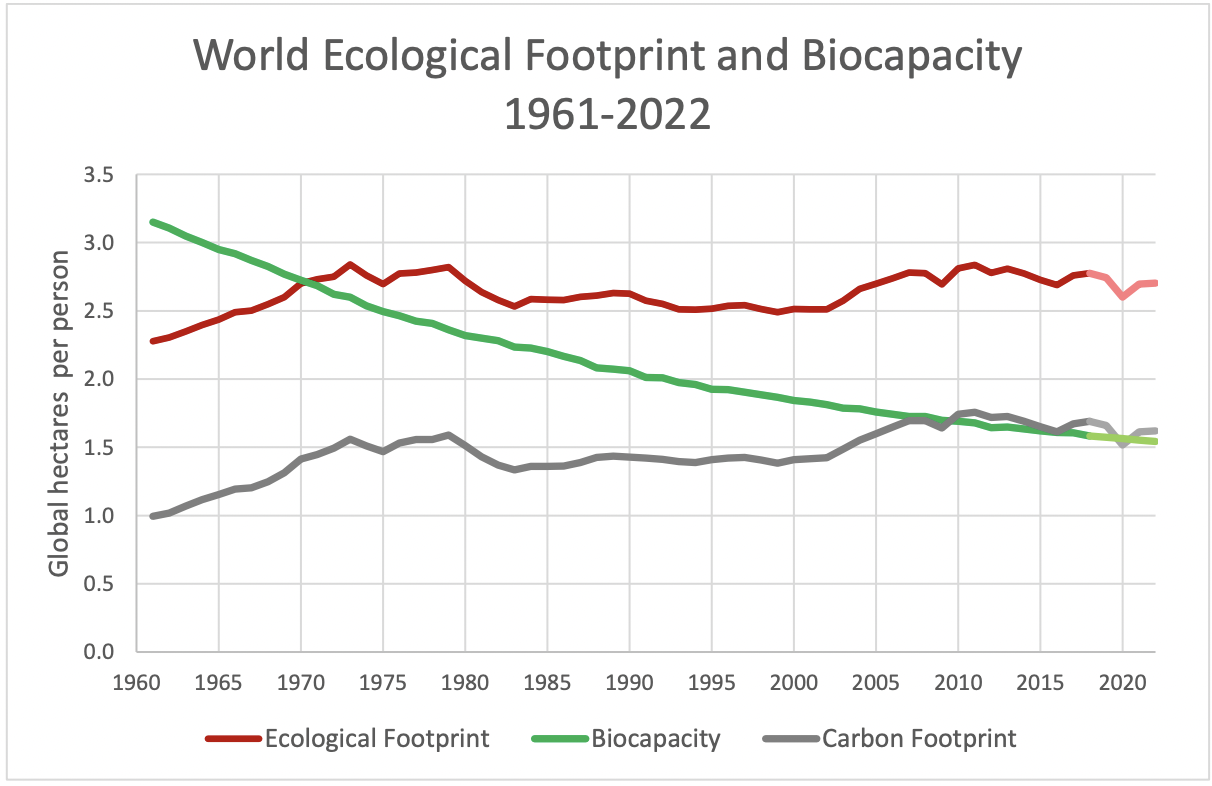
Global time-series showing the Ecological Footprint (red) compared with biocapacity (green) in global hectares per person; the grey line shows the carbon footprint subset. Where the red line exceeds the green, humanity is in ecological overshoot. This directly visualises the demand-versus-capacity relationship used in IB ESS. Source.
Measuring Carbon and Water Footprints
Two specialised forms of footprints provide additional detail.
Carbon Footprint: The total greenhouse gas emissions caused directly and indirectly by an individual, organisation, event, or product, usually measured in tonnes of CO₂-equivalent.
Water Footprint: The total volume of freshwater used to produce the goods and services consumed by an individual or community, including blue (surface/groundwater), green (rainwater), and grey (polluted water).


Green water (rain/soil moisture used by plants), blue water (surface and groundwater consumed or diverted), and grey water (freshwater needed to dilute pollutants to standards) are the three components of a product’s or population’s water footprint. These icons correspond to the standard WFN definitions used in IB ESS. The image is stylised and does not include text labels; definitions are provided in the surrounding text. Source.
These footprints highlight specific resource pressures and are widely used in both policy and business decision-making.
GDP and Green GDP
Conventional economic measures such as Gross Domestic Product (GDP) often fail to reflect environmental costs.
GDP: The total monetary value of all final goods and services produced in a country over a specific time period.
While GDP is a useful economic indicator, it overlooks resource depletion, pollution costs, and ecosystem degradation.
To address this, Green GDP is used.
Green GDP: An adjusted economic measure that incorporates environmental costs and natural resource depletion into GDP calculations.
This metric provides a more accurate picture of sustainable economic performance.
Citizen Science and Monitoring
Citizen science plays an important role in data collection and monitoring indicators. By involving the public in environmental monitoring, it:
Expands the scale and reach of data collection.
Increases public awareness and engagement.
Provides cost-effective monitoring of biodiversity, pollution, and climate.
Examples of Citizen Science Contributions
Recording bird species and population numbers.
Monitoring water quality in local rivers and lakes.
Tracking plastic waste along coastlines.
Citizen science helps close data gaps and empowers communities to contribute to environmental management.
Integrating Indicators, Footprints, and Biocapacity
The combined use of indicators, ecological footprints, and biocapacity allows for holistic sustainability assessments.
Key insights include:
Ecological overshoot signals global unsustainability.
Carbon and water footprints highlight resource-specific issues.
Green GDP links economic performance to ecological health.
Citizen science strengthens monitoring and public involvement.
By using these tools together, policymakers and communities can evaluate progress towards sustainability goals and identify areas where urgent change is required.
Practice Questions
Question 1 (2 marks)
Define the term biocapacity and explain how it differs from the ecological footprint.
Mark Scheme:
1 mark for a correct definition: biocapacity is the capacity of ecosystems to regenerate resources and absorb wastes, usually measured in global hectares per person.
1 mark for explaining the difference: ecological footprint measures demand (resource use and waste generation), whereas biocapacity measures supply (ecosystem capacity).
Discuss how the use of ecological, carbon, and water footprints can help evaluate the sustainability of a country.
Mark Scheme:
1 mark for identifying ecological footprint as a measure of total resource demand compared with biocapacity.
1 mark for describing the carbon footprint as a measure of greenhouse gas emissions, usually in tonnes of CO₂-equivalent.
1 mark for describing the water footprint as the total volume of water used, including green, blue, and grey components.
1 mark for linking these measures to sustainability: footprints greater than available biocapacity indicate unsustainability.
1 mark for evaluation: e.g., strengths (comparability, clarity, policy relevance) and/or limitations (simplification, reliance on assumptions).
FAQ
Ecological overshoot is determined by comparing humanity’s total ecological footprint with the planet’s biocapacity.
When the footprint exceeds available global hectares of biocapacity, the year’s resources are effectively “used up” before the year ends. This is represented annually by Earth Overshoot Day — the date when demand surpasses Earth’s capacity to regenerate.
Green GDP adjusts conventional GDP by including environmental degradation and natural resource depletion.
Controversy arises because:
Measuring environmental costs is complex and sometimes subjective.
Some governments worry Green GDP may show economic decline compared with traditional GDP.
Data gaps and inconsistent methods make cross-country comparisons difficult.
Indicators and footprints can be measured at multiple scales — individual, community, national, or global.
At small scales, they provide personal or local insight into consumption patterns.
At national or global levels, they help compare sustainability between countries and regions.
However, scaling up can reduce precision, as local variations and specific practices may be hidden.
Citizen science supports monitoring by gathering large-scale ecological data that would otherwise be too costly.
Examples include:
Recording plant growth cycles that reveal ecosystem productivity.
Tracking land cover change through open-source satellite imagery.
Monitoring soil and water quality that signals local regeneration capacity.
Although all measure environmental demand, they focus on different aspects.
Carbon footprint: climate change impact through greenhouse gas emissions.
Water footprint: pressure on freshwater resources, including green, blue, and grey water.
Ecological footprint: total bioproductive land and sea required for human use.
A limitation is that results are not always directly comparable. For example, a country may have a low carbon footprint but high water footprint, complicating sustainability assessments.
