
IB Syllabus focus:
‘Population distribution depends on abiotic and biotic factors. Measure temperature, sunlight, pH, salinity, dissolved oxygen, and soil texture; quantifying these clarifies species distributions (use data logging).’
Understanding how populations are distributed across ecosystems is essential in environmental systems and societies, as it reveals the influence of abiotic and biotic factors shaping biodiversity.
Population Distribution
The distribution of populations describes how individuals of a species are spread within their habitat. This can be uniform, random, or clumped. The distribution pattern depends on both the abiotic environment (non-living factors such as temperature and pH) and biotic interactions (living factors such as competition and predation). Studying these patterns helps ecologists understand where species can survive and thrive.
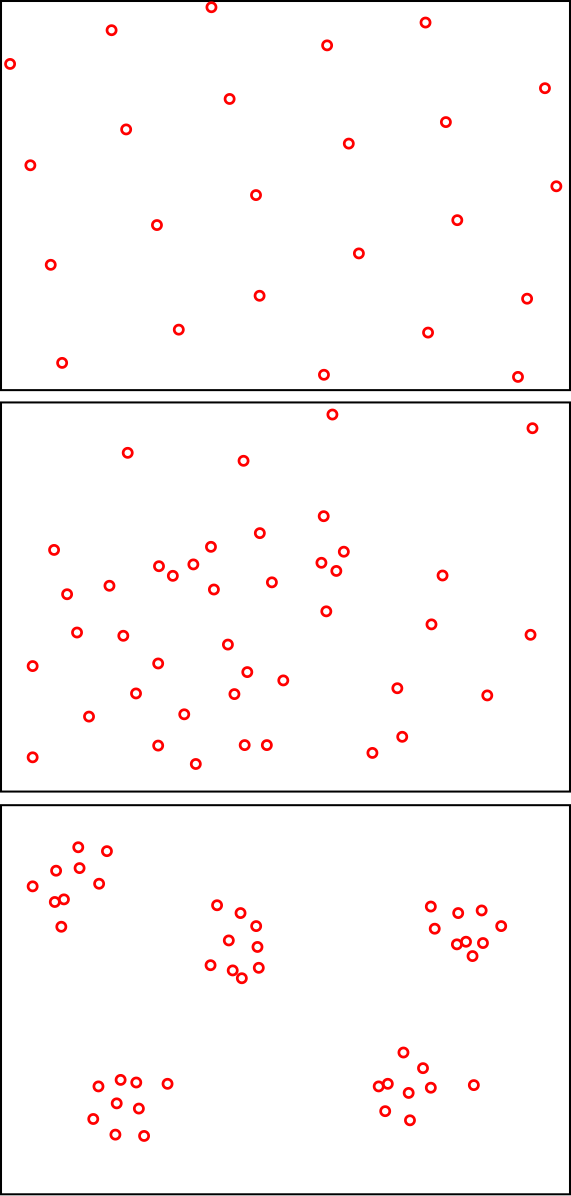
Diagram showing three common population distribution patterns: uniform spacing, random placement, and clumped grouping. These spatial patterns reflect underlying abiotic limits and biotic interactions. Use this to connect observed patterns to measured environmental drivers. Source.
Types of Distribution Patterns
Uniform distribution: Individuals are evenly spaced due to competition for resources or territorial behaviour.
Random distribution: Positions of individuals are independent of others, often found in environments with abundant resources.
Clumped distribution: The most common pattern, where individuals gather around resource-rich areas or social groupings.
Abiotic Factors and Their Influence
Abiotic factors determine the environmental limits within which populations can survive. Key measurable abiotic variables include:
Temperature
Affects metabolic rates and enzyme activity.
Populations are typically restricted to areas where temperatures are within their physiological tolerance range.
Sunlight
Directly influences photosynthesis and therefore food availability in ecosystems.
Determines the productivity of plants, shaping the distribution of herbivores and higher trophic levels.
pH
Impacts solubility of nutrients and toxins.
Certain species thrive only in specific pH ranges (e.g., fish in neutral waters, specialised plants in acidic soils).
Salinity
Governs the osmoregulatory stress organisms face.
High salinity restricts freshwater species, while marine organisms adapt to varying levels.
Dissolved Oxygen
Essential for aerobic respiration in aquatic organisms.
Levels vary with temperature, flow rate, and organic pollution; low oxygen can exclude sensitive species.
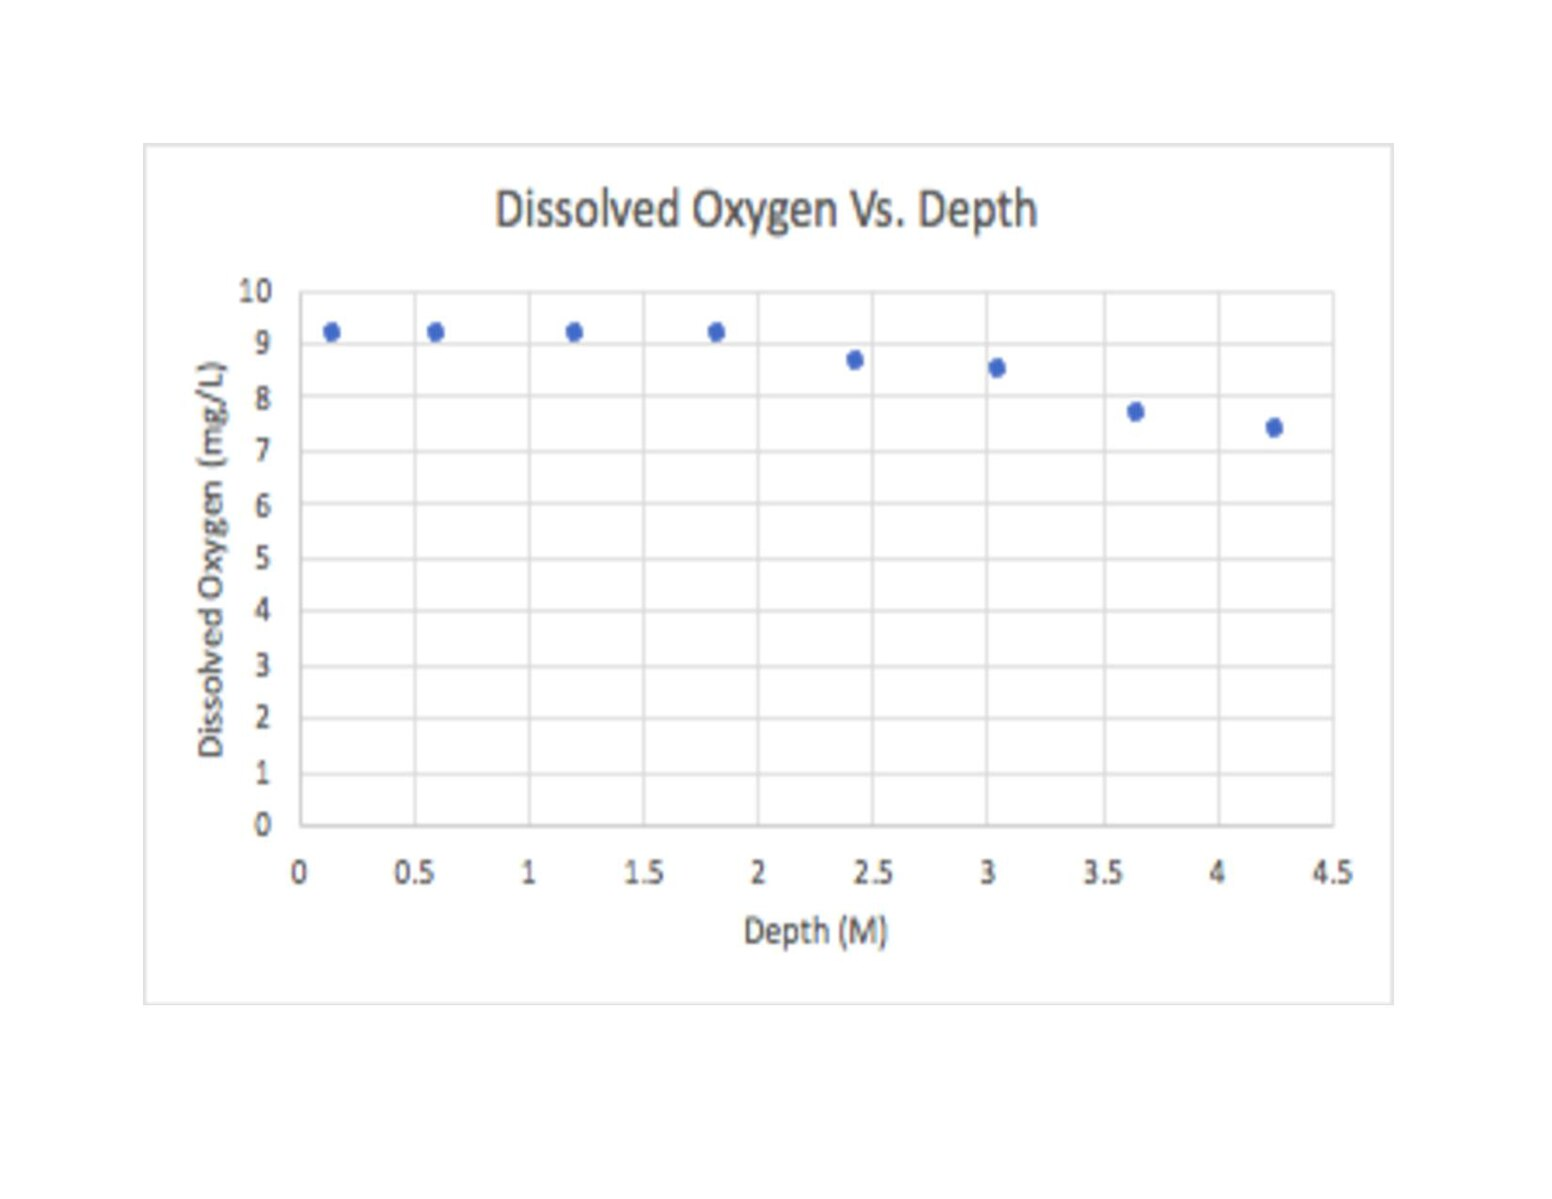
A depth profile plotting dissolved oxygen (mg L⁻¹) against depth (m). Such profiles illustrate hypoxic deeper waters versus oxygen-richer surface layers, clarifying habitat limits for aquatic species. Use alongside DO probe measurements in fieldwork. Source.
Soil Texture
Determines water retention, aeration, and nutrient availability.
Clay-rich soils support different plant communities than sandy or loamy soils.
Abiotic factor: A non-living component of the environment that influences where and how species can survive.
Measuring Abiotic Factors
Modern ecological studies employ data logging equipment to obtain accurate, continuous readings of abiotic factors. Measurements can be taken across spatial gradients and over time. Typical methods include:
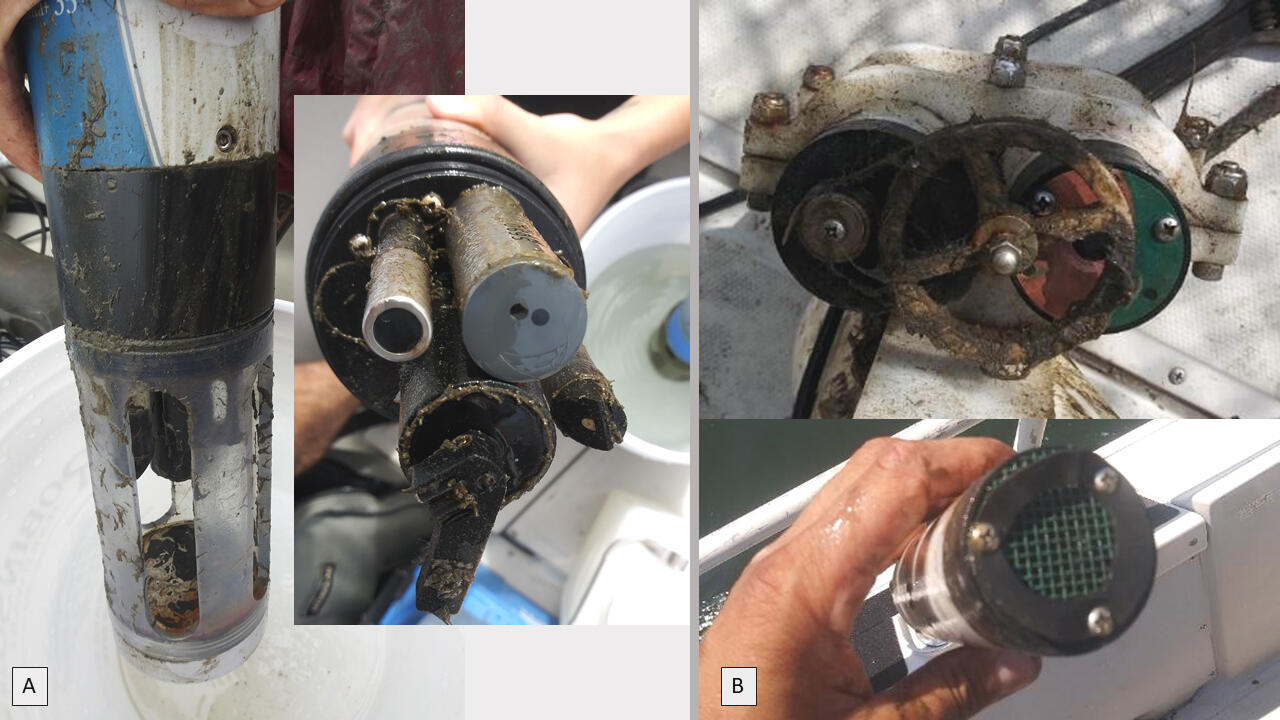
Photographs of multiparameter sondes and smaller dissolved oxygen/temperature sensors used for continuous water-quality monitoring. These instruments log abiotic variables (e.g., temperature, pH, conductivity/salinity, DO) across space and time. The image includes additional details such as a probe wiper mechanism not required by the syllabus. Source.
Temperature: Thermometers or digital probes.
Sunlight intensity: Light meters measuring lux or photosynthetically active radiation.
pH: Portable pH meters or litmus paper for soils and waters.
Salinity: Conductivity meters or refractometers.
Dissolved oxygen: Oxygen probes or Winkler titration.
Soil texture: Sedimentation tests to determine proportions of sand, silt, and clay.
Collecting this data helps reveal correlations between species presence and environmental conditions.
Linking Abiotic Factors to Distribution
The relationship between abiotic factors and population distribution is central to ecology. For instance:
Shifts in temperature due to climate change may force species poleward or to higher elevations.
Low dissolved oxygen zones in lakes (hypoxic areas) restrict fish populations to surface layers.
Variations in soil texture shape plant root systems and nutrient uptake, determining vegetation patterns.
Population distribution: The pattern of how individuals of a species are spread within their habitat, influenced by abiotic and biotic conditions.
Biotic Influences on Distribution
Although this subsubtopic emphasises abiotic factors, biotic elements cannot be ignored. Interactions with other organisms, such as competition for food or avoidance of predators, modify how populations respond to abiotic environments. For example, two species may tolerate the same pH but compete for limited nutrients, restricting one’s distribution.
Quantifying Relationships with Data
Quantification provides scientific evidence to explain species distributions. Ecologists may:
Map species presence along gradients (e.g., from shore to deep water).
Use correlation analysis between abiotic measurements and population density.
Apply modelling tools to predict distribution changes under altered environmental conditions.
Data logging ensures precise, reliable results, allowing students and researchers to detect subtle patterns in ecosystems.
Importance for IB Environmental Systems and Societies
This subsubtopic emphasises practical fieldwork skills. Students are expected to measure abiotic variables and interpret their influence on populations. By linking ecological theory with field data, students learn to:
Identify limiting factors shaping species’ ranges.
Recognise the interplay between abiotic and biotic influences.
Appreciate the role of technological tools in ecological studies.
Limiting factor: An environmental variable that restricts population growth or distribution when in short supply or beyond tolerance limits.
These methods and concepts provide essential foundations for understanding ecological patterns and the sustainability of ecosystems.
