
IB Syllabus focus:
‘Estimate abundance using random, systematic, or transect sampling. Quadrat methods give density, percentage cover, and frequency for non-mobile organisms. For mobile species, use capture–mark–recapture and the Lincoln index (M×N/R) with stated assumptions.’
Estimating populations in the field is fundamental to understanding ecosystem dynamics. Accurate measurement techniques allow ecologists to study species abundance, distribution, and relationships within natural systems.
Approaches to Population Estimation
Random Sampling
Random sampling involves selecting study sites or quadrats entirely by chance. This ensures that every part of the habitat has an equal chance of being included, reducing bias.
Particularly useful when studying homogeneous habitats such as grasslands.
Helps establish baseline data for long-term ecological monitoring.
Systematic Sampling
Systematic sampling follows a fixed pattern, such as placing quadrats at regular intervals along a line.
Effective when studying transitions across environmental gradients (e.g., from shore to inland).
Allows ecologists to track gradual changes in abundance or community composition.
Transect Sampling
Transects are straight lines drawn through a habitat along which data are collected.
Line transects: record presence/absence of species touching the line.
Belt transects: wider strips with multiple quadrats along the line, providing more detail.
Ideal for investigating zonation, such as vegetation changes along a tidal shore.
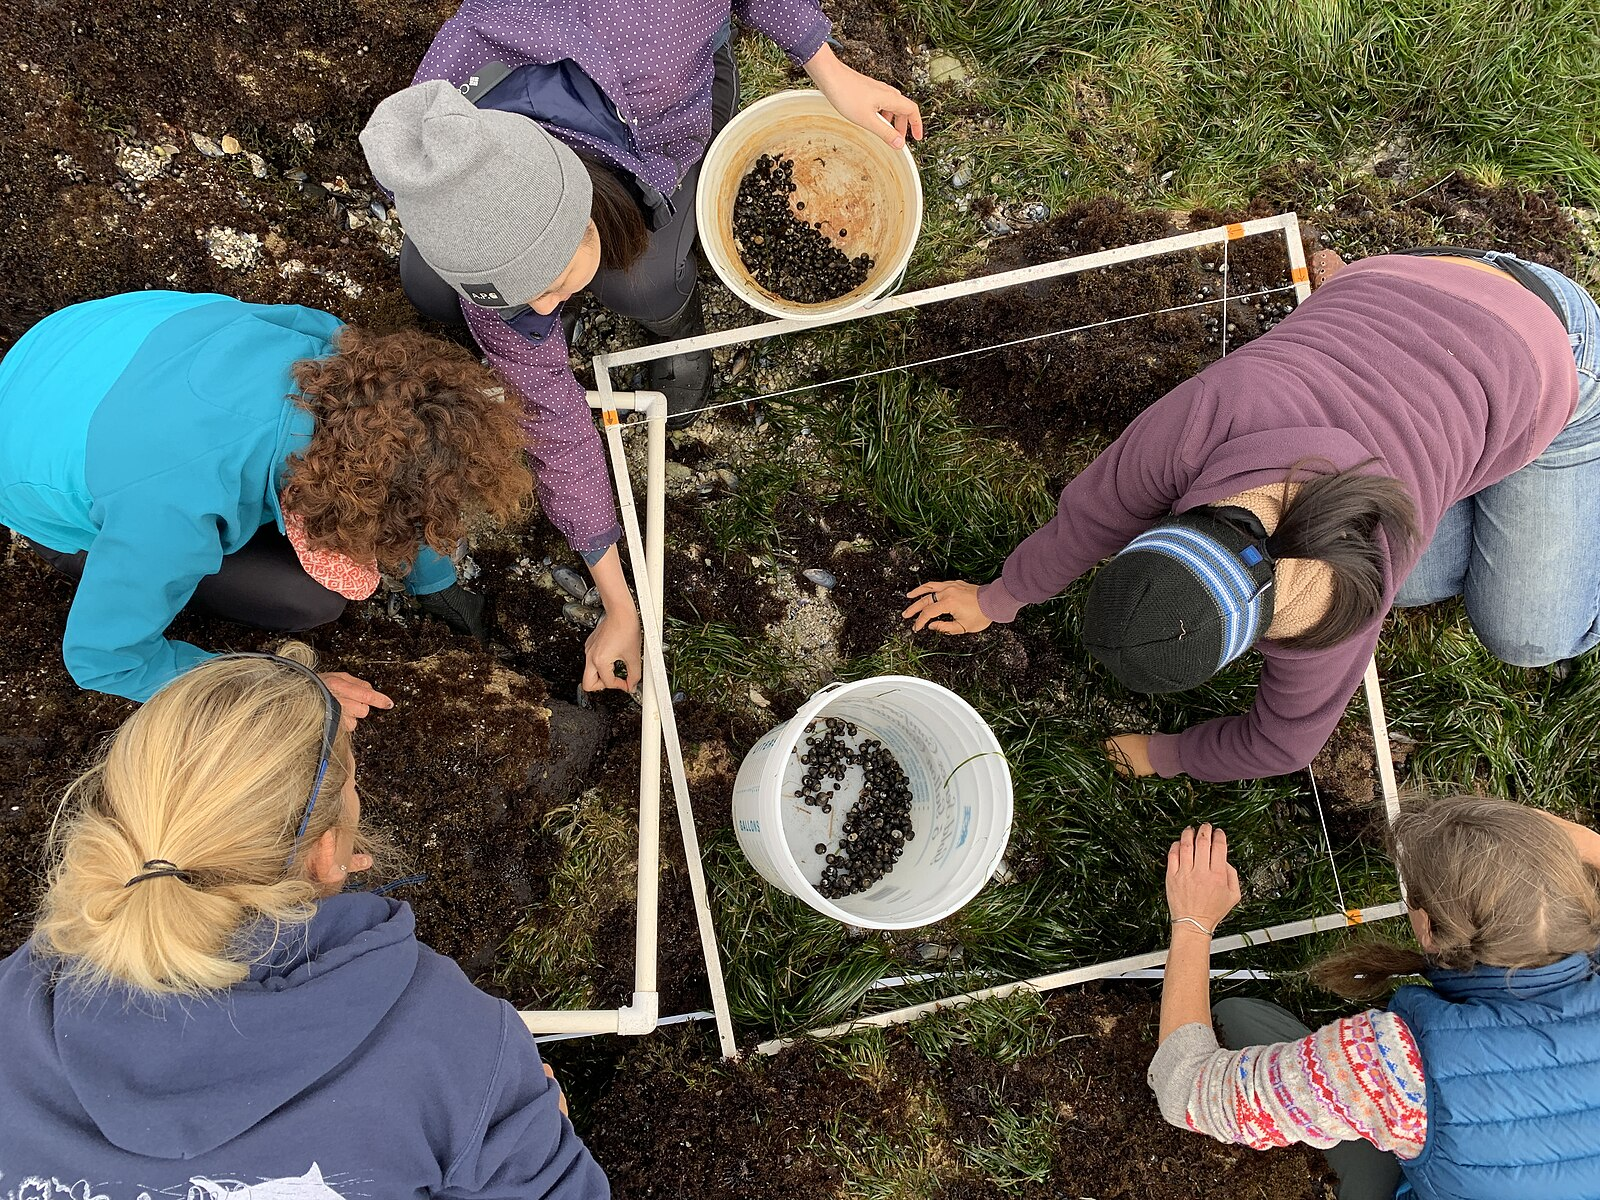
Field team laying a transect tape across intertidal rock platforms with quadrats positioned at set intervals to record species presence and cover. This operational view reinforces how belt transects couple spatial gradients with repeated quadrat samples. Source.
Quadrat-Based Techniques for Non-Mobile Species
Quadrat Methods
Quadrats are square sampling frames used to standardise study areas.
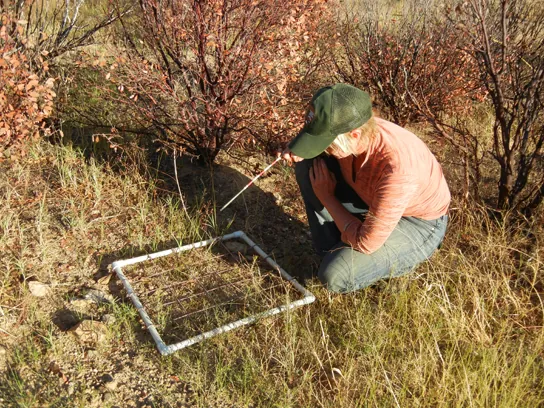
This photograph shows a field ecologist using a square quadrat frame to delineate a fixed sampling area, enabling repeatable counts of organisms within its boundary. The image reinforces the role of quadrats in estimating density and percentage cover for sedentary species. Source.
Quadrat size depends on the species studied: smaller for mosses/lichens, larger for shrubs.
Placing quadrats randomly or systematically avoids selective bias.
Types of Measurements
Quadrats allow calculation of:
Density: Number of individuals per unit area.
Percentage cover: Proportion of the quadrat covered by a species.
Frequency: Proportion of quadrats in which a species is found.
Density: The number of individuals of a species per unit area.
Estimating Mobile Species Populations
Capture–Mark–Recapture
For animals that move freely, capture–mark–recapture is the most common method.
Step 1: Capture a sample of individuals and mark them in a harmless, visible way.
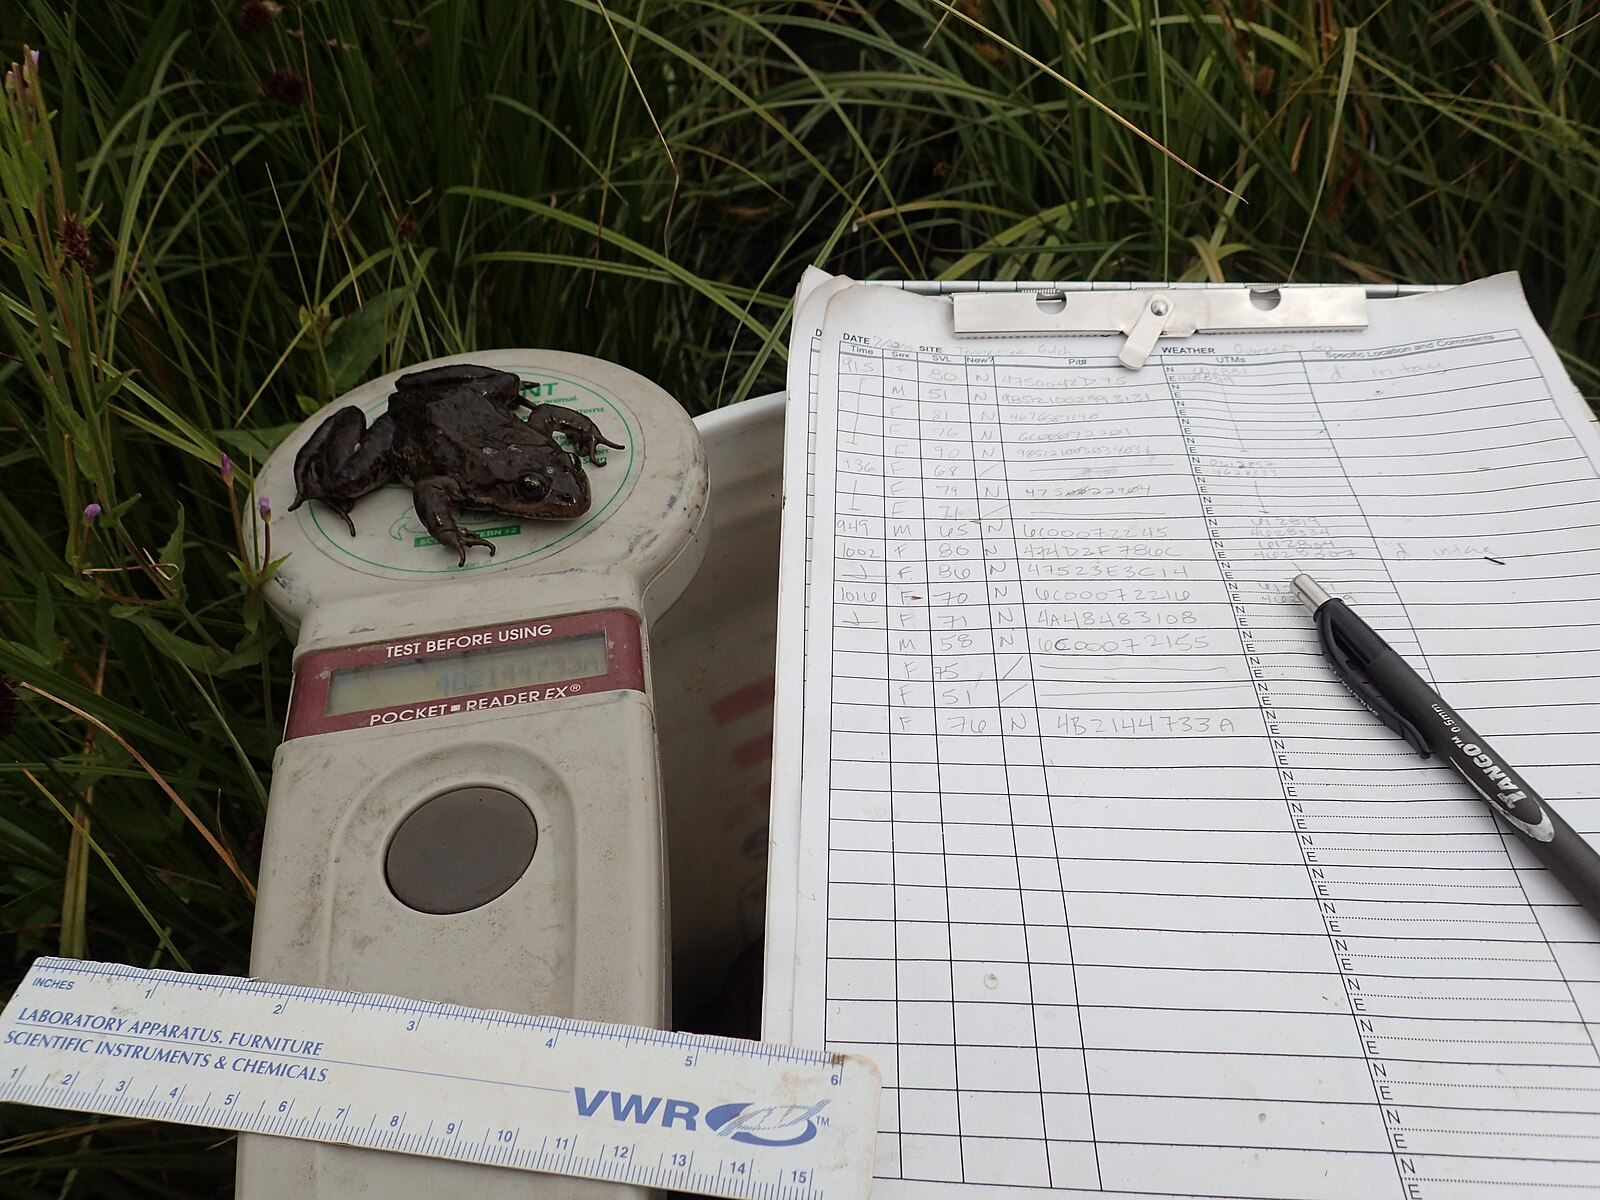
Researchers measure and mark a Columbia spotted frog during a long-term mark–recapture survey, exemplifying ethical handling and individual identification prior to release. The photo includes PIT-tagging and biometric measurements, which are practical details beyond the basic IB ESS requirement. Source.
Step 2: Release them back into the population and allow them to mix.
Step 3: Recapture another sample and record how many marked individuals appear.
This method is widely applied to mammals, fish, and insects.
The Lincoln Index
The Lincoln index is used to calculate population size from capture–mark–recapture data.
Lincoln Index (N) = (M × n) / R
M = Number of individuals initially marked
n = Total number of individuals in the second sample
R = Number of marked individuals recaptured
Assumptions of the Lincoln Index
The method depends on specific assumptions:
The population is closed (no significant immigration, emigration, births, or deaths).
Marks remain visible and do not harm or influence survival.
Each individual has an equal chance of capture.
Sufficient time has elapsed for mixing between samples.
The Role of Technology in Field Estimation
Data Logging and Sensors
Modern ecology benefits from data logging equipment, which provides accurate abiotic factor measurements during population studies.
Temperature probes
Dissolved oxygen meters
pH sensors
Light intensity meters
Integrating such data helps explain observed distribution and abundance patterns.
Remote Sensing and GIS
Remote sensing techniques and geographical information systems (GIS) allow ecologists to:
Map large-scale distributions.
Detect habitat changes over time.
Complement field-based sampling with broader perspectives.
Limitations and Challenges
Sources of Error
Random chance may misrepresent small populations.
Observer error in identifying or counting species.
Seasonal variations affecting detectability.
Practical Constraints
Accessibility of habitats (e.g., wetlands, dense forests).
Behaviour of species (e.g., nocturnal or cryptic animals).
Ethical concerns, particularly when marking may affect survival or reproduction.
Summary of Key Methods
Quadrats: Effective for plants and immobile organisms, giving density, percentage cover, and frequency.
Transects: Useful for studying gradients and zonation.
Capture–Mark–Recapture: Provides population size estimates for mobile species when Lincoln index assumptions are met.
Technology: Enhances accuracy and scale of ecological investigations.
Practice Questions
Question 1 (2 marks):
State two assumptions that must be met when using the Lincoln index to estimate population size.
size.
Mark scheme:
Population is closed with no significant immigration, emigration, births, or deaths (1 mark).
Marks remain visible, do not harm individuals, and do not affect survival or behaviour (1 mark).
(Any two correct assumptions, maximum 2 marks.)
Question 2 (5 marks):
Describe how quadrat sampling and capture–mark–recapture are used to estimate populations, and explain one advantage and one limitation of each method.
Mark scheme:
Quadrat sampling: quadrats are placed randomly or systematically; density, percentage cover, or frequency of non-mobile organisms measured (1 mark).
Advantage: simple, inexpensive, allows standardised comparison between sites (1 mark).
Limitation: not suitable for mobile species, possible sampling bias (1 mark).
Capture–mark–recapture: animals captured, marked harmlessly, released, then recaptured to estimate population size using the Lincoln index (1 mark).
Advantage: allows estimates of mobile populations (1 mark).
Limitation: assumes closed population, equal chance of capture, and mark retention (1 mark).
(Maximum 5 marks; clear descriptions plus one advantage and one limitation for each method expected.)
FAQ
Combining both methods helps reduce bias while capturing environmental variation. Random sampling ensures each part of a habitat is equally represented, while systematic sampling reveals gradual changes along gradients.
Quadrat size depends on:
The size of the species (smaller quadrats for mosses, larger for shrubs).
The density of organisms (denser populations may require smaller quadrats).
Habitat type (open fields versus dense forests).
Choosing the wrong size risks underestimating or overestimating population data.
Marks must be non-toxic, durable, and not interfere with survival or reproduction. Common approaches include:
Non-toxic paint or dye for insects.
Leg bands or wing tags for birds.
Passive integrated transponder (PIT) tags for amphibians or mammals.
Pilot studies are often run to confirm the marking method is safe.
In small populations, random variation strongly affects results. If too few individuals are captured or recaptured, the proportion of marked animals becomes unrepresentative.
This can produce large errors in estimated population size. Multiple sampling rounds and larger capture efforts help reduce uncertainty.
Abiotic factors explain why species are distributed as observed. For example:
Light intensity and soil pH may influence plant cover in quadrats.
Temperature or dissolved oxygen affects aquatic species along a transect.
Recording abiotic variables alongside population estimates allows ecologists to link species abundance to environmental conditions.

.jpg)