
IB Syllabus focus:
‘Total fertility rate, life expectancy, natural increase, and doubling time (rule of 70) quantify population dynamics and allow comparisons between places and over time.’
Understanding how populations grow, shrink, or stabilise requires reliable tools. Population metrics provide clear, measurable ways to track demographic changes and compare different regions worldwide.
Key Population Metrics
Population dynamics are assessed using several core measurements. Each metric highlights a different aspect of demographic change and helps geographers, policymakers, and environmental scientists analyse trends.
Total Fertility Rate (TFR)
The Total Fertility Rate (TFR) is a measure of the average number of children a woman is expected to have over her lifetime, based on current age-specific fertility rates.
Total Fertility Rate (TFR): The average number of children a woman would have during her lifetime if current fertility rates remain constant.
A TFR of approximately 2.1 is considered the replacement level fertility in most societies, as it allows each generation to replace itself, accounting for child mortality.
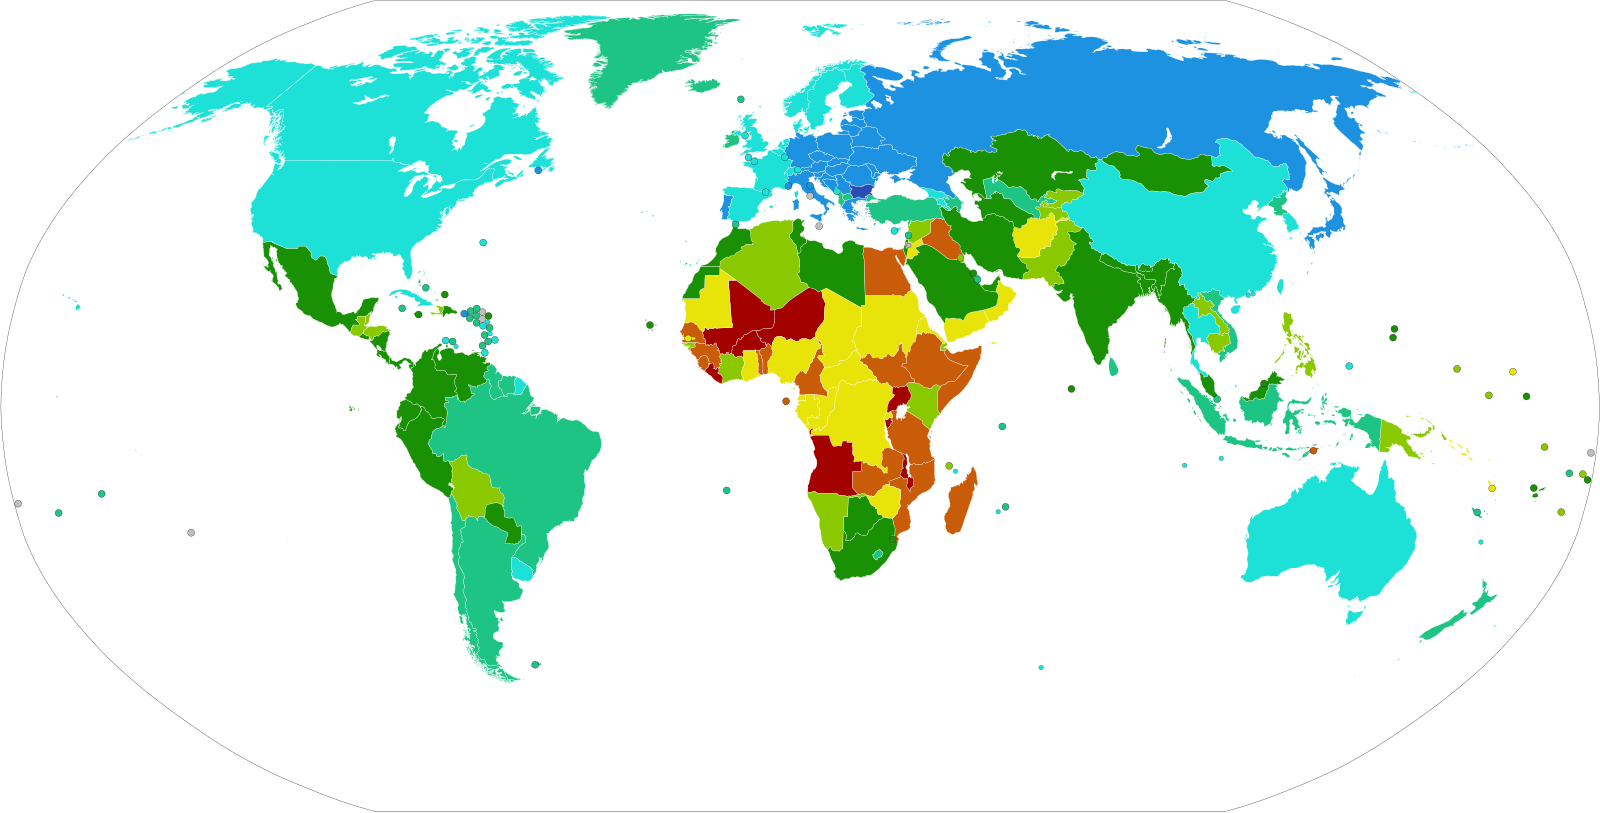
Global Total Fertility Rate (births per woman) by country, showing variation in contemporary fertility levels used for comparative population analysis. Colours indicate TFR bands commonly used in demographic reporting. The map is a clean, labelled SVG suitable for high-resolution use. Source.
Life Expectancy
Life expectancy indicates the average number of years a person is expected to live from birth, assuming current mortality rates remain constant.
Life Expectancy: The average number of years a newborn is expected to live if current mortality patterns continue throughout their life.
High life expectancy generally correlates with better healthcare, nutrition, and living standards, while lower values may signal poor health systems or instability.
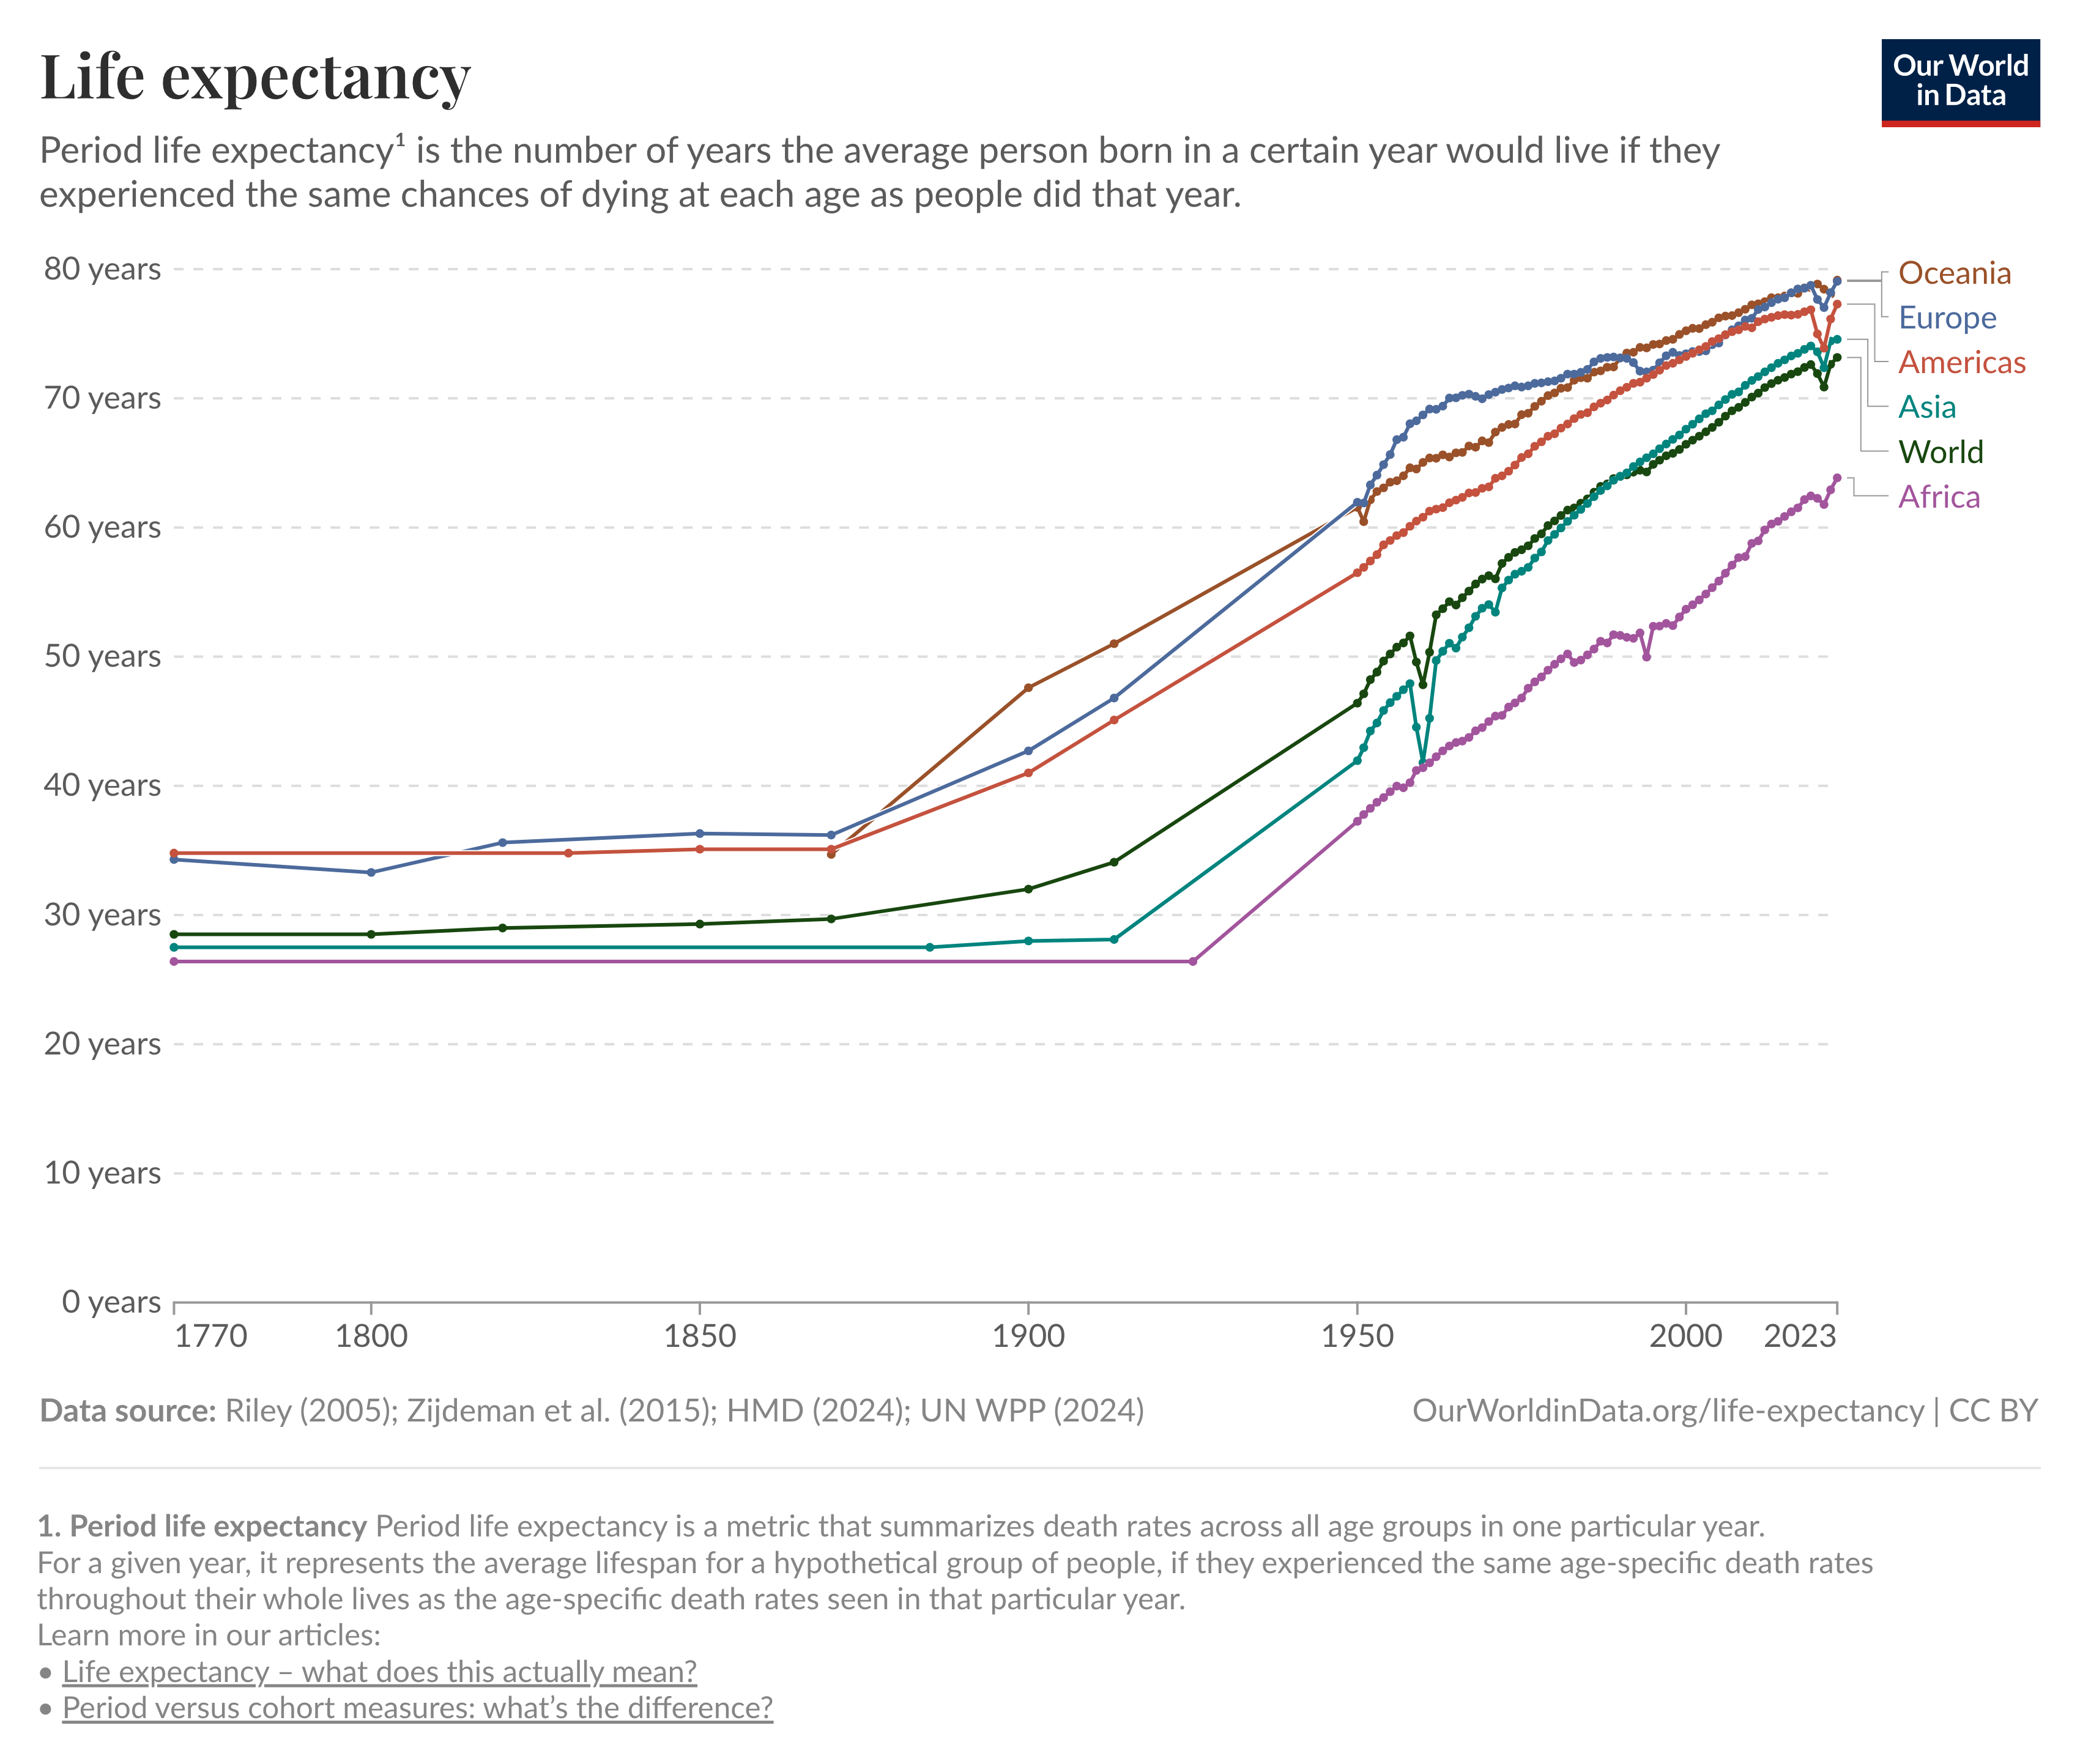
Interactive map of life expectancy at birth used to compare longevity across countries, reflecting differences in mortality patterns. Downloadable as high-resolution SVG/PNG for teaching materials. Some additional charts on the page extend beyond the syllabus, but the map itself focuses on the core metric. Source.
Natural Increase Rate (NIR)
The Natural Increase Rate measures how quickly a population grows or declines, excluding migration. It is calculated using crude birth and death rates.
Natural Increase Rate (NIR): The difference between the crude birth rate and the crude death rate, expressed as a percentage.
A positive NIR means a population is growing, while a negative value means it is shrinking without immigration.
Natural Increase Rate (%) = (Crude Birth Rate – Crude Death Rate) ÷ 10
Crude Birth Rate (CBR) = Number of births per 1,000 people per year
Crude Death Rate (CDR) = Number of deaths per 1,000 people per year
This metric helps identify demographic pressures, such as youthful populations requiring more schools or ageing populations needing more healthcare.
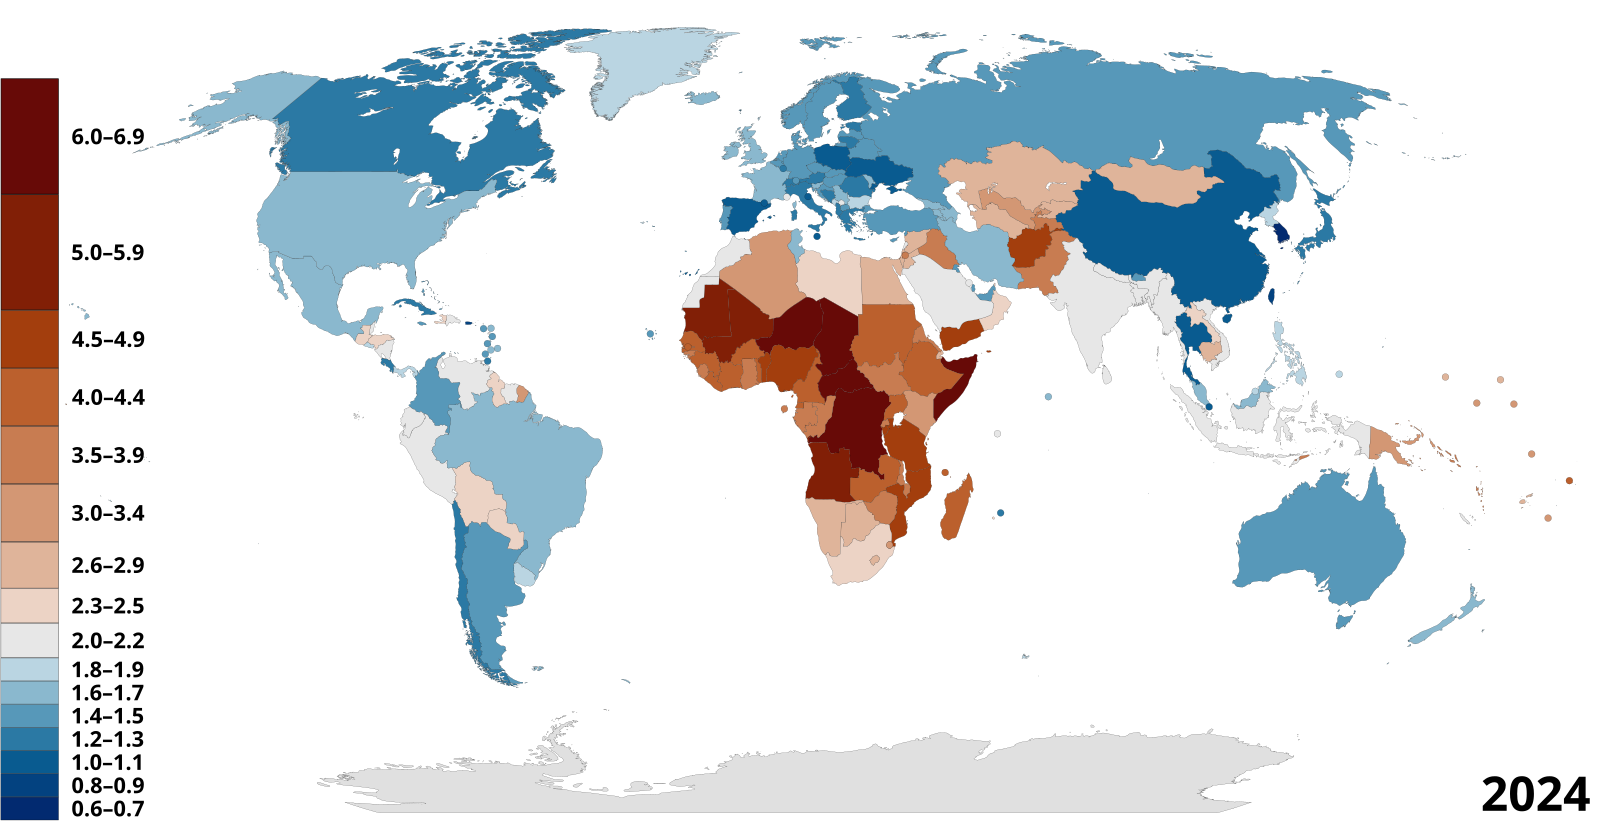
World map of the Rate of Natural Increase (per 1,000) from the CIA World Factbook, illustrating where births exceed deaths and where natural decrease occurs. Colours correspond to clearly labelled RNI bands, aiding quick comparison. Year is 2017 (historical snapshot), which is adequate for illustrating the metric itself. Source.
Doubling Time and the Rule of 70
Doubling time estimates how long it will take for a population to double in size at its current growth rate. This uses the Rule of 70, a quick mathematical method.
Doubling Time: The number of years it takes for a population to double in size, given its current growth rate.
Doubling Time = 70 ÷ Growth Rate (%)
Growth Rate (%) = The annual rate of population change (births – deaths + migration).
This measure provides insight into how fast demographic change is occurring. A country with a 3% growth rate would double its population in about 23 years.
Applications of Population Metrics
Comparisons Between Countries and Regions
These metrics allow comparisons between places with very different demographic characteristics:
High-income countries often show low fertility, long life expectancy, and slow growth.
Low-income countries may exhibit high fertility, shorter life expectancy, and rapid doubling times.
Such comparisons reveal contrasts in social, economic, and environmental challenges.
Monitoring Change Over Time
Tracking changes in fertility, mortality, and growth rates helps identify demographic transitions, such as declining fertility during industrialisation or rising life expectancy due to medical advances.
Policy Relevance
Governments and organisations rely on these metrics to make decisions. For example:
Education and healthcare planning depend on knowing the size of the young or elderly population.
Infrastructure investment requires predictions of urban growth.
Environmental planning benefits from anticipating pressures caused by expanding populations.
Interconnections Between Metrics
Each metric connects to the others, reinforcing a complete picture of demographic change:
Declining fertility reduces natural increase.
Rising life expectancy alters age structures, increasing dependency ratios.
Fast natural increase shortens doubling time, creating challenges for sustainable resource use.
Understanding these links helps predict the social, economic, and environmental implications of population change.
Factors Influencing Population Metrics
Population indicators are shaped by many social and economic factors, including:
Healthcare and nutrition improving survival rates.
Education, especially female education, lowering fertility.
Cultural and religious values influencing family size.
Economic conditions affecting mortality and fertility choices.
Government policies directly or indirectly shifting birth and death rates.
These influences highlight why population dynamics vary so widely between regions and why projections remain uncertain.
Summary of Key Equations and Measures
Total Fertility Rate (TFR): Average lifetime children per woman.
Life Expectancy: Average years of life at birth.
Natural Increase Rate (NIR): (CBR – CDR) ÷ 10.
Doubling Time: 70 ÷ Growth Rate (%).
These essential tools help environmental systems and societies students analyse how human populations evolve and their impacts on sustainability.
Practice Questions
Question 1 (2 marks)
Define the term life expectancy and explain what a high life expectancy generally indicates about a country’s social or economic conditions.
Mark scheme:
1 mark for a correct definition: Life expectancy is the average number of years a newborn is expected to live if current mortality patterns continue.
1 mark for explanation: e.g., higher standards of healthcare, nutrition, or general living conditions.
Question 2 (5 marks)
Using the Rule of 70, explain how doubling time is calculated and discuss what a short doubling time suggests about a country’s population dynamics and potential challenges.
Mark scheme:
1 mark for correctly stating the equation: Doubling Time = 70 ÷ Growth Rate (%).
1 mark for noting that a high growth rate produces a short doubling time.
1 mark for explaining that a short doubling time indicates rapid population growth.
1 mark for discussing at least one potential challenge: e.g., strain on resources, pressure on healthcare or education, urban overcrowding.
1 mark for a second valid challenge or consequence: e.g., environmental degradation, food insecurity, increased unemployment.
FAQ
Replacement fertility is slightly higher than 2.0 because it accounts for child mortality and the fact that not all children will survive to adulthood and reproduce.
This value can vary slightly by region, depending on health conditions and mortality rates, but 2.1 is generally used as a global standard.
Life expectancy may fall due to:
Epidemics or pandemics
Political instability and conflict
Environmental disasters (e.g., drought, famine)
Collapse of healthcare systems
Even short-term shocks can reduce average life expectancy values for entire populations.
The natural increase rate (NIR) considers only births and deaths.
Total population growth rate also includes migration. Countries with low NIR may still grow if immigration is high, while high NIR countries could see slower growth if large-scale emigration occurs.
The Rule of 70 is based on logarithmic growth and approximates the time it takes for something growing at a constant percentage rate to double.
While simplified, it provides a reliable estimate for demographic studies, especially when precise calculations are unnecessary.
When paired with fertility, life expectancy, and natural increase data, age–sex pyramids can:
Highlight dependency ratios
Indicate whether a population is ageing or youthful
Reveal the impacts of policies or historic events on specific cohorts
This combination helps planners design effective social and economic policies.
