
IB Syllabus focus:
‘Age–sex pyramids show population structure by age and gender, revealing growth patterns, dependency, and planning needs.’
Age–sex pyramids are essential demographic tools used in population studies, offering clear visual insights into age distribution, gender balance, and related societal implications.
Understanding Age–Sex Pyramids
An age–sex pyramid is a graphical representation of a population’s age and gender structure. Typically, males are displayed on the left and females on the right, with horizontal bars showing the proportion or absolute number of individuals in each age group. The base represents young cohorts, while the top shows older cohorts.
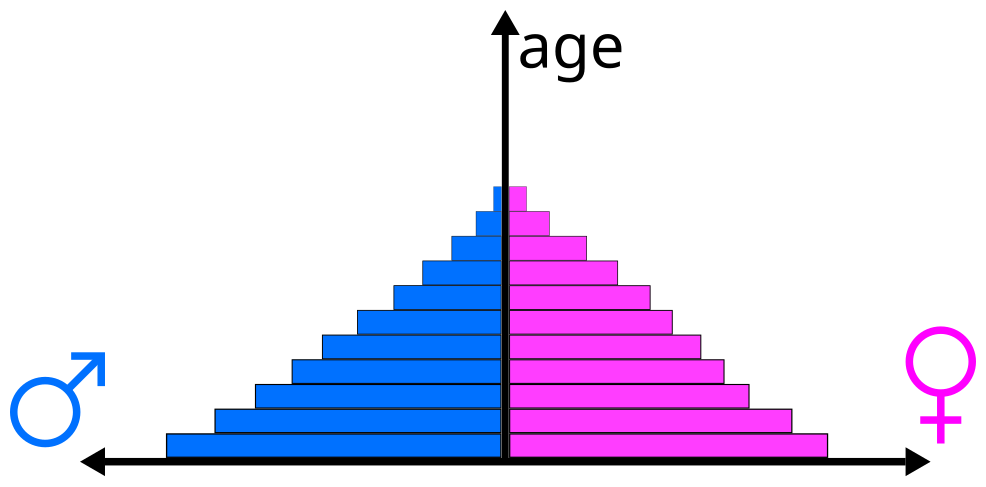
Sample age–sex pyramid with males on the left, females on the right, five-year age cohorts on the y-axis, and population share on the x-axis. This labelled template clarifies how bars represent cohort size and how overall shape indicates population structure. Source.
Age–Sex Pyramid: A diagram that illustrates the distribution of a population by age group and gender, usually in the shape of a pyramid.
The shape of the pyramid reflects underlying birth rates, death rates, and migration patterns, which together reveal the demographic health and developmental stage of a population.
Key Features of Age–Sex Pyramids
Width of the Base
A wide base suggests high birth rates, often found in less economically developed countries.
A narrow base indicates low birth rates or declining fertility.
Shape of the Sides
Concave sides suggest high death rates, especially in younger or middle-aged cohorts.
Vertical or bulging sides reflect lower mortality and longer life expectancy.
Apex of the Pyramid
A pointed top reflects short life expectancy and limited elderly populations.
A broader top indicates longer life expectancy, typical of more developed nations.
Interpreting Age–Sex Pyramids
Age–sex pyramids are powerful tools for identifying growth patterns and societal pressures. They highlight:
Population growth stage (expanding, stable, or contracting).
Dependency ratios (proportion of dependent age groups to the working-age population).
Gender imbalances caused by cultural, political, or conflict-related factors.
Dependency Ratio: The ratio of non-working-age population (children under 15 and elderly over 65) to the working-age population (15–64).
A high dependency ratio suggests significant economic pressure on the working population to support dependants.
Types of Age–Sex Pyramids
Expansive Pyramid
Broad base, narrow top.
Indicates high birth rates and high death rates.
Typical of developing countries in earlier stages of the Demographic Transition Model (DTM).
Stationary Pyramid
Narrower base, more uniform shape.
Reflects low birth rates and longer life expectancy.
Seen in countries in the later stages of the DTM with stable populations.
Contractive Pyramid
Narrow base and relatively wide upper sections.
Suggests declining birth rates and an ageing population.
Common in highly developed nations with below-replacement fertility.
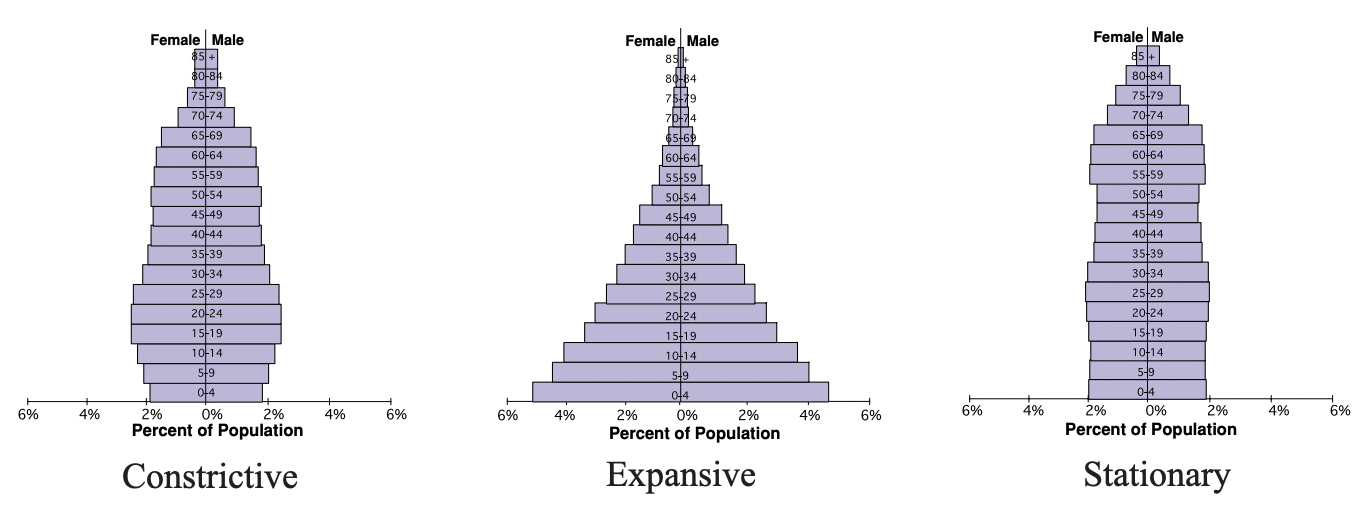
Three prototypical population-pyramid shapes: constrictive (narrow base), expansive (wide base), and stationary (nearly rectangular). These shapes visualise fertility and mortality patterns that determine population growth, stabilisation, or ageing. Source.
Applications of Age–Sex Pyramids
Age–sex pyramids are crucial in planning and policy-making. They help governments and organisations:
Forecast future population growth or decline.
Plan for education systems based on youth cohorts.
Design healthcare systems considering ageing populations.
Address labour market needs by anticipating shifts in working-age population.
Prepare pension and welfare systems to support an ageing demographic.
For example, a country with a youthful pyramid will prioritise investment in schools, maternal health, and job creation, whereas an ageing pyramid requires focus on elder care, healthcare services, and pension sustainability.
Age–Sex Pyramids and the Demographic Transition Model
The Demographic Transition Model (DTM) describes changes in birth and death rates over time as societies develop. Each stage is associated with a characteristic pyramid shape:
Stage 1: Expansive pyramid with high birth and death rates.
Stage 2: Expansive but beginning to narrow at the sides as death rates fall.
Stage 3: Stationary shape as birth rates decline.
Stage 4: Contractive pyramid with ageing populations and low birth rates.
Stage 5 (optional extension): Extreme contraction, with shrinking populations and high proportions of elderly.
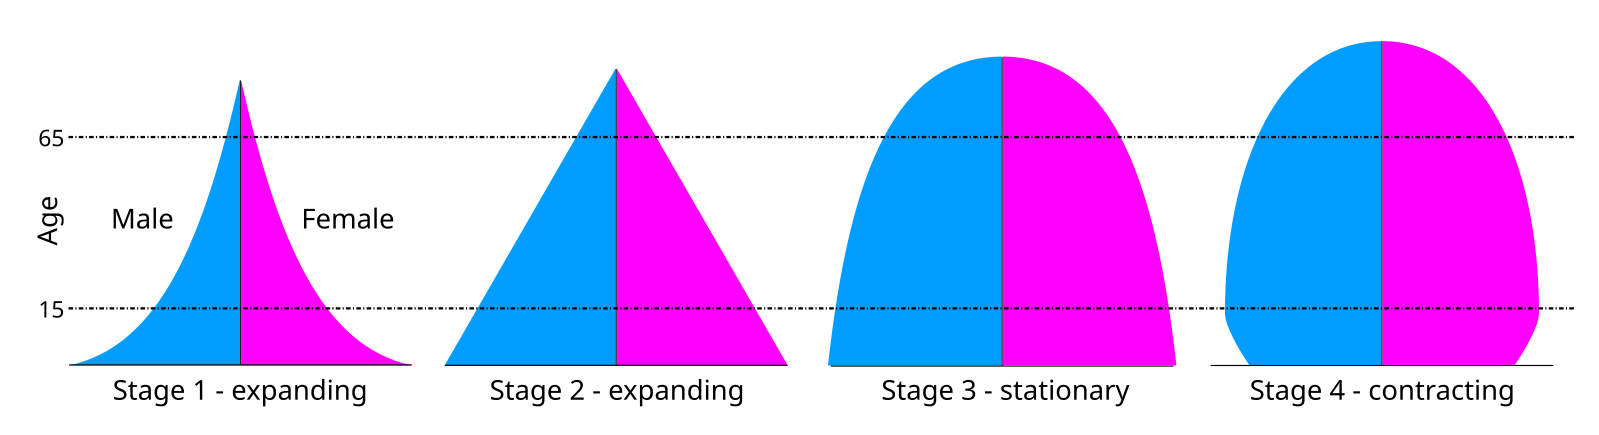
Population-pyramid silhouettes aligned with DTM stages illustrate how falling death rates and then birth rates alter pyramid shape from expansive to stationary/contractive. This visual reinforces stage–shape associations discussed in the text. Source.
Demographic Transition Model (DTM): A framework describing population changes over time, from high birth and death rates to low birth and death rates.
Limitations of Age–Sex Pyramids
Although highly useful, age–sex pyramids have limitations:
They provide a snapshot in time and do not show future dynamics.
They cannot fully explain migration flows, cultural changes, or economic shocks.
Misleading scales or intervals can distort interpretation.
They do not show the reasons behind demographic changes, only the outcomes.
Using Age–Sex Pyramids in Environmental Systems and Societies
In the context of Environmental Systems and Societies (ESS), age–sex pyramids link directly to issues of sustainability, urban planning, and resource management:
Rapid population growth in developing countries increases pressure on natural resources and ecosystems.
Ageing populations in developed nations create demand for sustainable healthcare and adaptive housing.
Migration patterns visible in pyramids can reflect environmental displacement, such as climate refugees.
By connecting demographic structures to environmental outcomes, students can analyse how population patterns shape challenges like food security, pollution, and urban expansion.
Practice Questions
Question 1 (2 marks)
Define an age–sex pyramid and explain what information it provides about a population.
Mark scheme:
Definition of an age–sex pyramid as a diagram showing the distribution of a population by age and gender (1 mark).
Reference to the information it provides, such as growth trends, gender balance, or dependency patterns (1 mark).
Question 2 (5 marks)
Using examples, explain how the shape of an age–sex pyramid can indicate the stage of a country within the Demographic Transition Model (DTM).
Mark scheme:
Correct identification of at least one pyramid shape (expansive, stationary, contractive) linked to a DTM stage (1 mark).
Explanation of expansive pyramid features (wide base, narrow top) and link to Stage 1 or 2 of the DTM (1 mark).
Explanation of stationary pyramid features (uniform shape, narrower base) and link to Stage 3 or 4 of the DTM (1 mark).
Explanation of contractive pyramid features (narrow base, wider top) and link to Stage 4 or 5 of the DTM (1 mark).
Use of relevant example(s) of countries or regions that reflect these pyramid types (1 mark).
FAQ
Migration often alters the middle cohorts (working-age groups). A bulge in these age ranges may indicate inward migration for employment, while a dip can reflect emigration or conflict-driven displacement.
Governments analyse the size of different cohorts to guide investment:
A broad base signals the need for schools and childcare.
A swelling middle population suggests job creation and housing demand.
A large elderly population requires healthcare and pension planning.
Gender imbalances may arise from cultural preferences, selective migration, or conflict. These distortions can affect marriage patterns, labour markets, and social stability in the long term.
A high dependency ratio means fewer workers support more dependants, increasing economic strain. A low ratio, sometimes called a demographic dividend, can boost economic growth if jobs are available.
They provide only a snapshot and do not account for unpredictable changes such as wars, pandemics, or sudden migration shifts. Projections based solely on pyramid shape may therefore be unreliable.
