Question 1
A student is studying how membrane-bound structures in eukaryotic cells work together to process and transport cellular products. The diagram below shows several organelles that are part of this system.
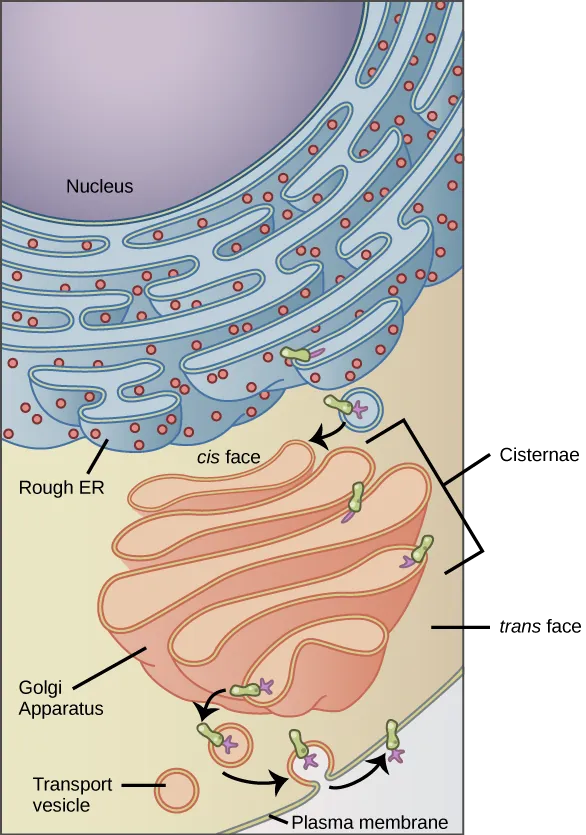
Identify two membrane-bound components shown in the diagram that are part of the endomembrane system.
Explain how the structure of the Golgi complex contributes to its function in cells.
Predict the effect on protein trafficking if vesicle formation from the Golgi complex were inhibited. [2 marks]
Question 2
A student compares cells with different dimensions to investigate why very large cells are uncommon. The diagram below models how surface area and volume change as cell size increases.
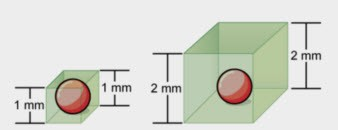
Describe the relationship between cell size and surface area-to-volume ratio shown in the diagram.
Explain why a lower surface area-to-volume ratio can restrict cell size.
Make a claim about which modeled cell would exchange materials with the environment more efficiently.
Question 3
Cell size and exchange of materials
Students investigated how cell size affects the exchange of materials with the environment. They used agar cubes of different sizes containing an indicator and placed the cubes in vinegar. The time taken for each cube to become completely clear was recorded. The results are shown in the graph below.
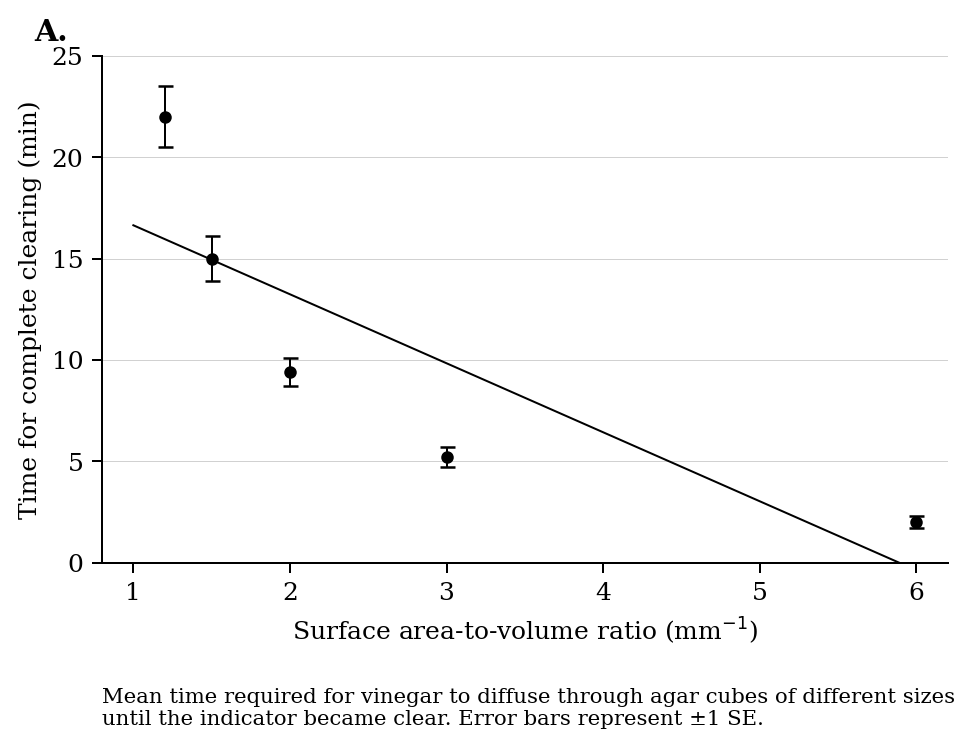
Identify the relationship between surface area-to-volume ratio and the time required for complete clearing.
Explain why smaller cells typically exchange materials more efficiently than larger cells.
Calculate the approximate difference in clearing time between a cube with a surface area-to-volume ratio of 1.2 mm⁻¹ and a cube with a surface area-to-volume ratio of 6.0 mm⁻¹.
Justify the claim that surface area-to-volume ratio can restrict cell size.
Question 4
Membrane permeability
Scientists measured the relative movement of different substances across an artificial phospholipid membrane. No transport proteins were included in the membrane. The results are shown in the bar chart below.
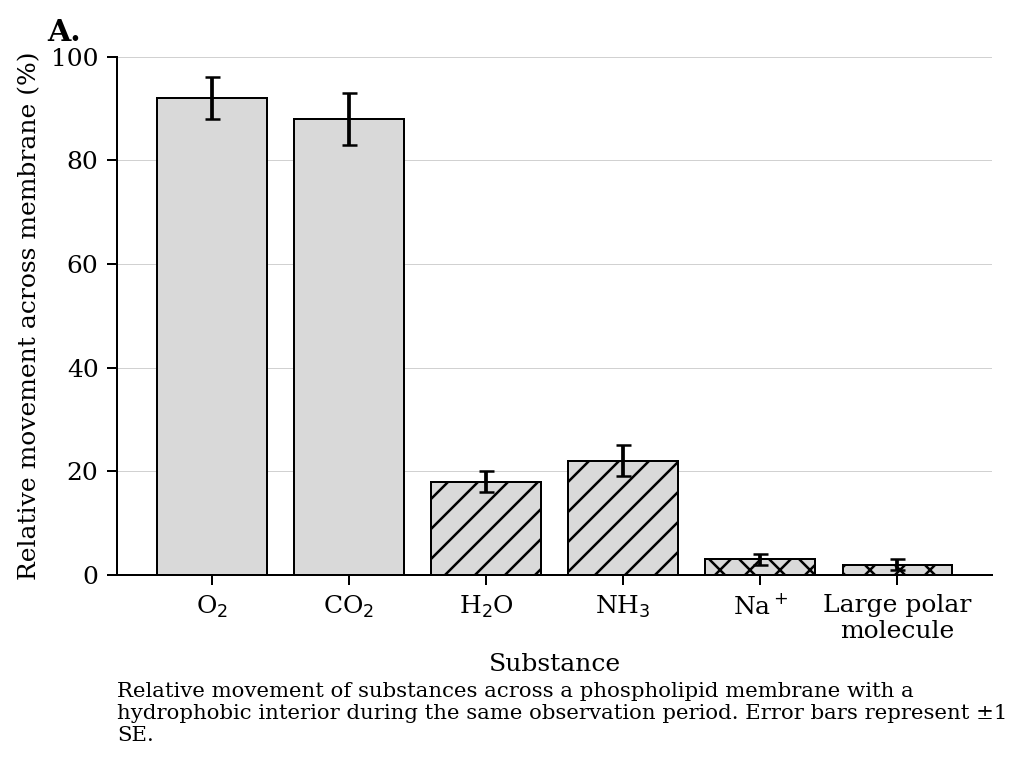
Identify the two substances that moved most freely across the membrane.
Describe the difference in movement between nonpolar molecules and ions across the membrane.
Explain how the hydrophobic interior of the membrane produces selective permeability.
Predict how the movement of Na⁺ would change if appropriate channel proteins were added to the membrane.
Question 5
Question 6
Question 7
Question 8
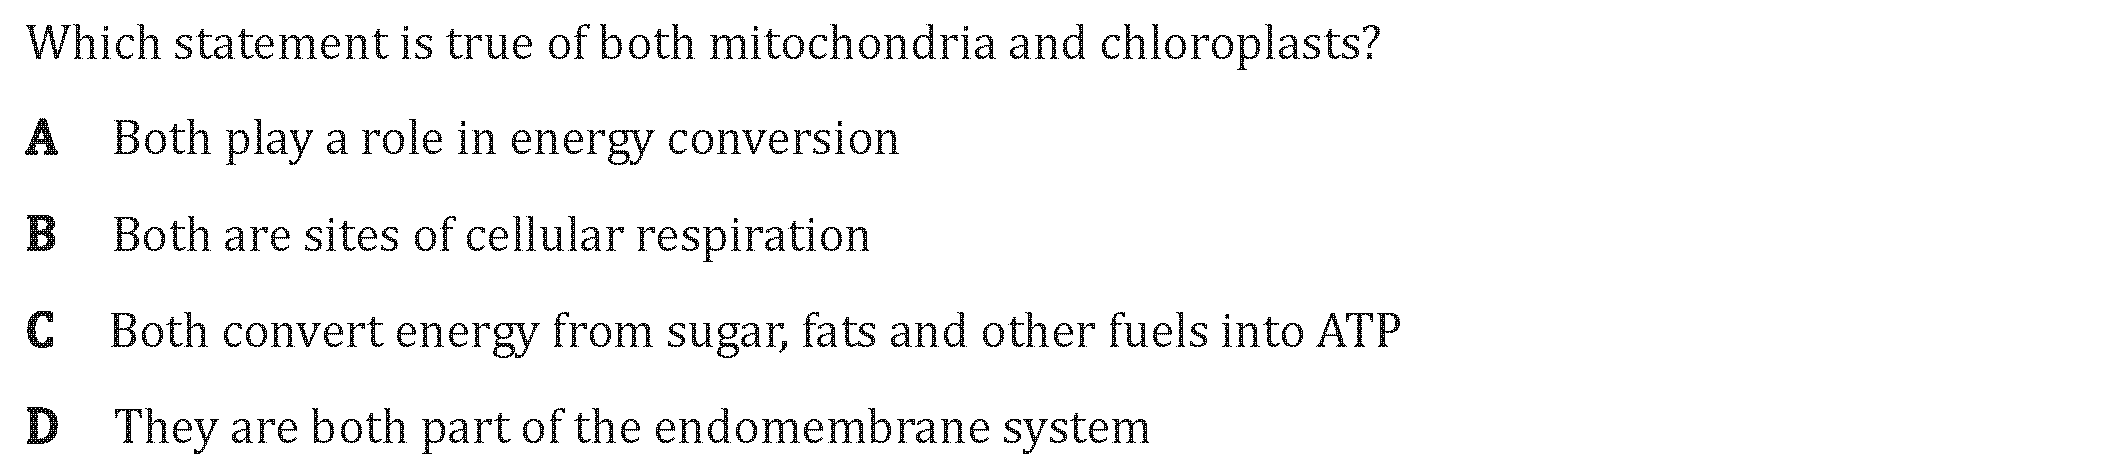
Question 9
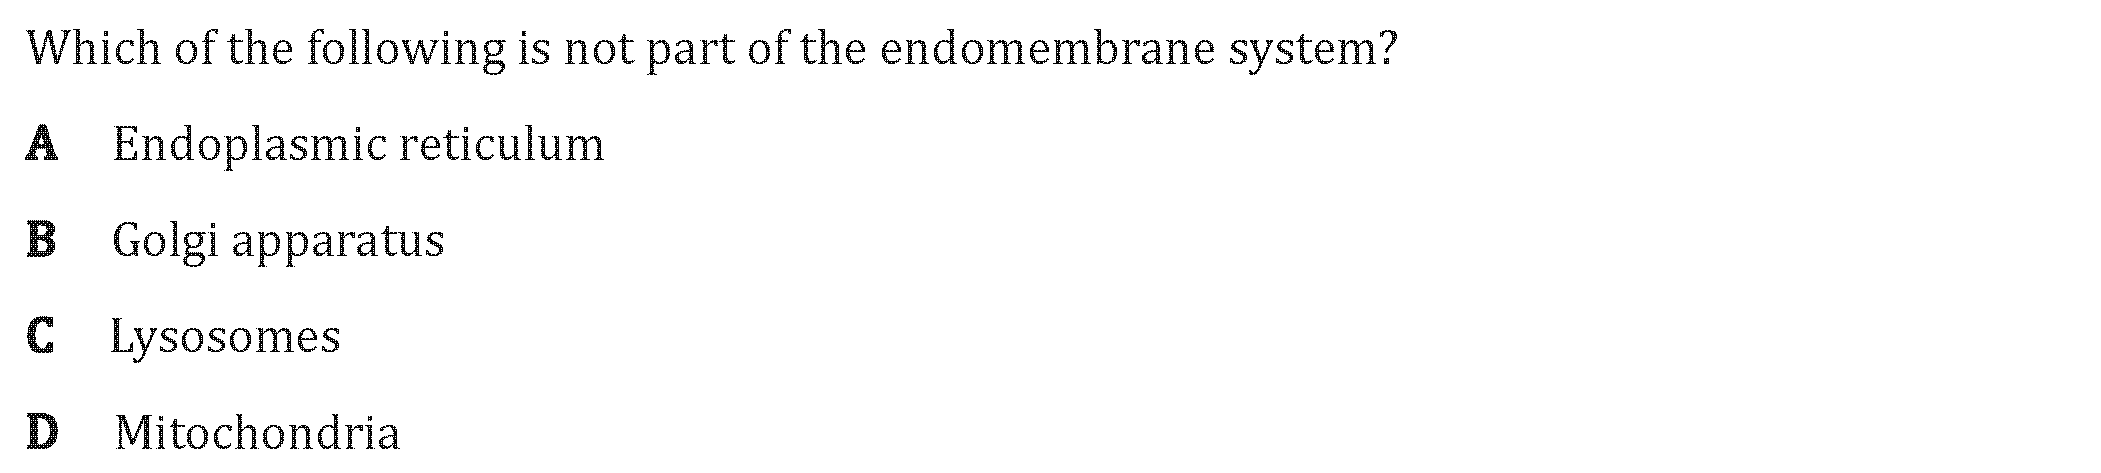
Question 10