

Question 1
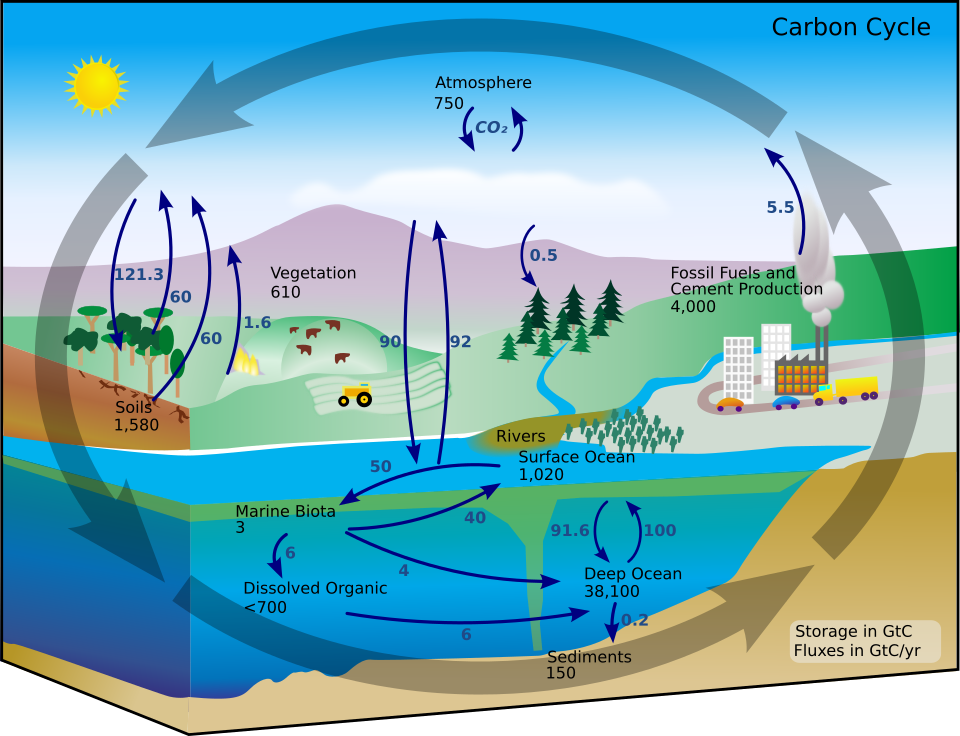
A class is studying ecosystems, biomes, biogeochemical cycles, primary productivity, trophic levels, energy transfer, and food webs. The diagram below shows movement of carbon among several reservoirs. Based on the arrows shown, which process most directly transfers carbon from vegetation to the atmosphere?
A. Photosynthesis
B. Cellular respiration
C. Sedimentation
D. Nitrogen fixation
Question 2
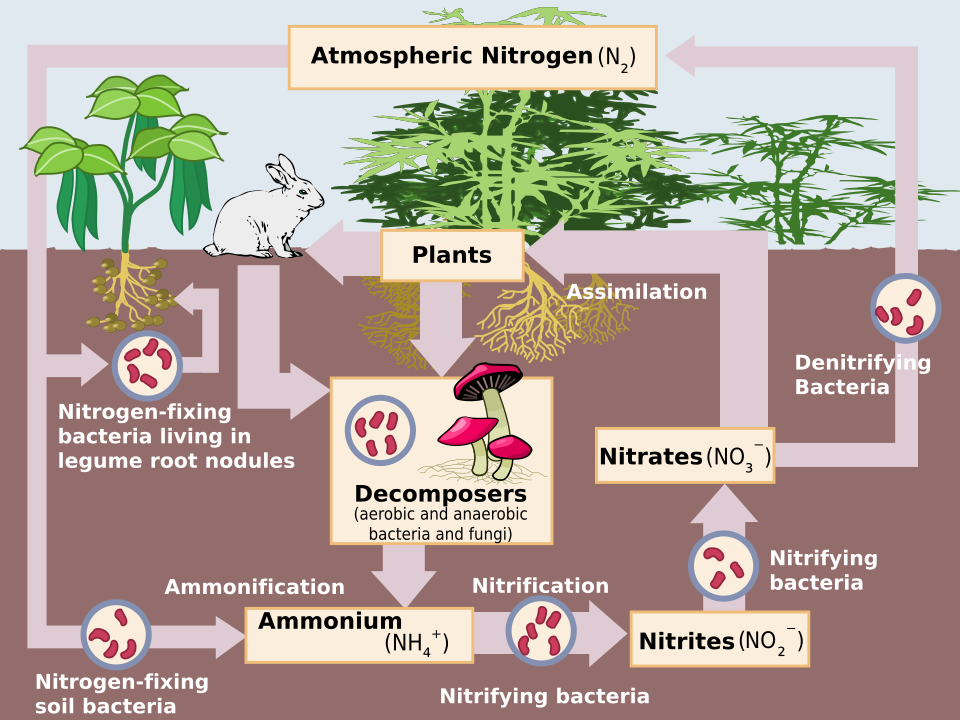
The diagram below models transformations of nitrogen compounds in an ecosystem. Which pathway shown makes atmospheric nitrogen available for uptake by plants?
A. Denitrifying bacteria convert nitrates into atmospheric nitrogen.
B. Nitrogen-fixing bacteria convert atmospheric nitrogen into plant-available nitrogen.
C. Decomposers convert atmospheric nitrogen directly into oxygen.
D. Plants convert nitrates into atmospheric nitrogen.
Question 3
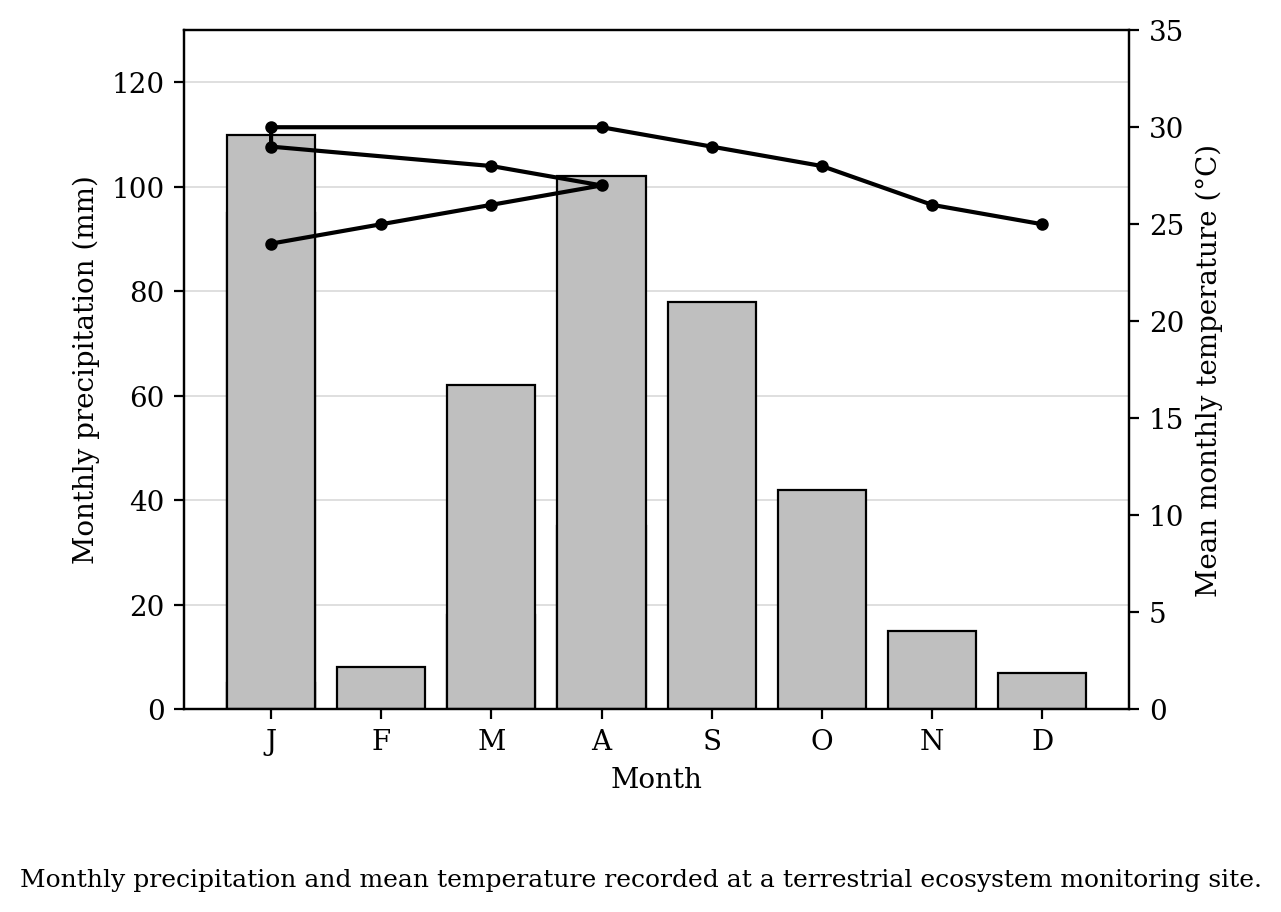
A class monitors climate data at a terrestrial ecosystem site. The graph below shows monthly precipitation and mean monthly temperature. Terrestrial biomes contain characteristic plant and animal communities that result from, and are adapted to, climate. Which claim is best supported by the data shown?
A. The site has nearly constant precipitation throughout the year.
B. The site has a warmer period that occurs at the same time as the highest precipitation.
C. The site has its highest precipitation during the coolest months.
D. The site has temperature values that vary more than precipitation values.
Question 4
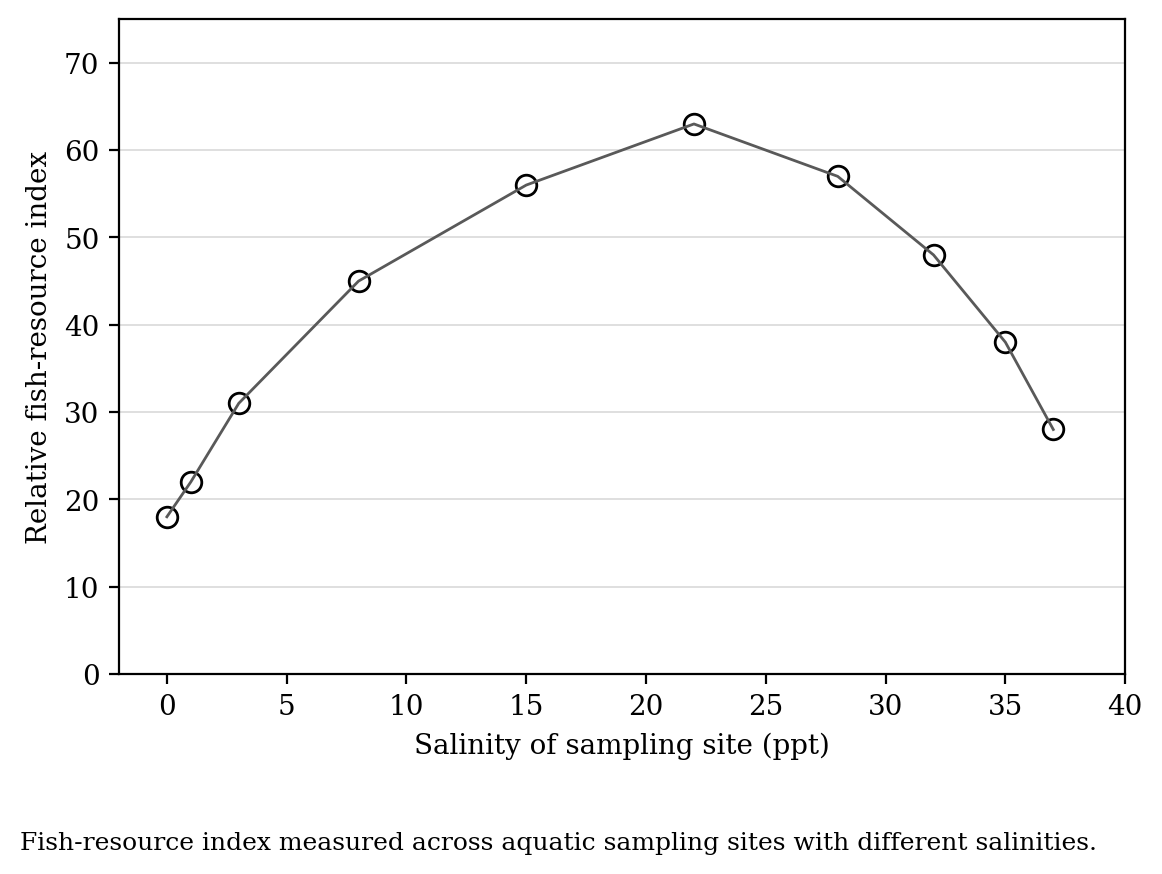
Researchers sampled aquatic sites that differed in salinity and calculated a relative fish-resource index for each site. The graph below shows the results. The distribution of nonmineral marine resources, such as fish, can vary with salinity, depth, turbidity, nutrient availability, and temperature. Which statement best describes the relationship shown?
A. The fish-resource index increases continuously as salinity increases.
B. The fish-resource index is greatest at intermediate salinity values.
C. The fish-resource index is lowest at intermediate salinity values.
D. The fish-resource index is not related to salinity.
Question 5
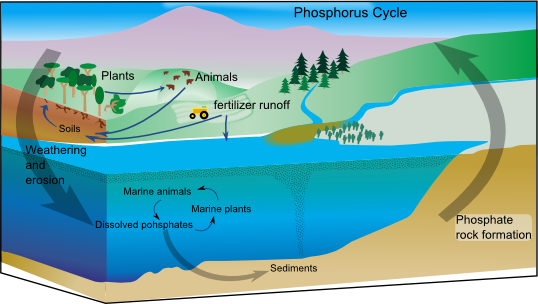
The diagram below shows movement of phosphorus through rocks, soil, water, and organisms. Which statement is best supported by the diagram?
A. Phosphorus cycles mainly through the atmosphere before entering organisms.
B. Phosphorus enters ecosystems primarily from phosphorus-bearing rocks and sediments.
C. Phosphorus is transferred from plants to animals only through evaporation.
D. Phosphorus is stored mainly as nitrogen gas in the atmosphere.
Question 6
The diagram below shows the hydrologic cycle in a watershed and coastal area. Which process shown transfers water from liquid surface water into the atmosphere as water vapor?
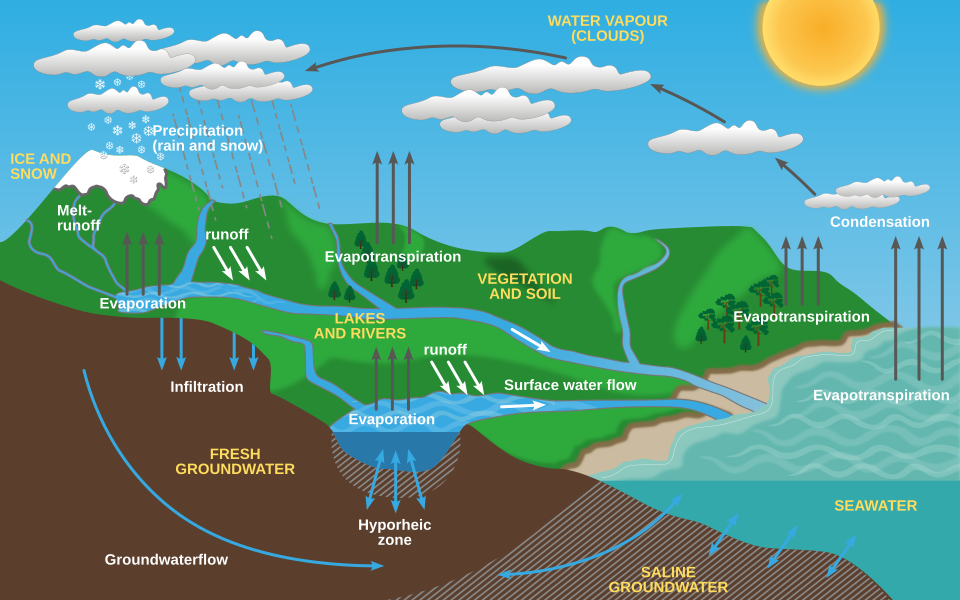
A. Evaporation
B. Infiltration
C. Groundwater flow
D. Precipitation
Question 7
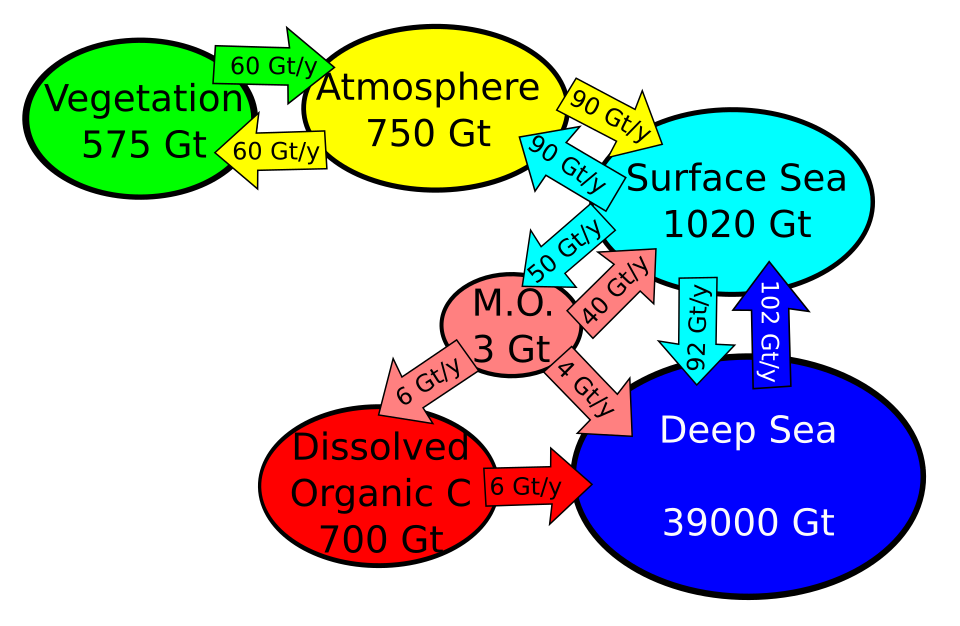
The diagram below shows carbon reservoirs and fluxes in gigatons of carbon. Which reservoir shown stores the greatest amount of carbon?
A. Vegetation
B. Atmosphere
C. Surface sea
D. Deep sea
Question 8
The map below shows the global distribution of major terrestrial biomes. Which explanation best accounts for the repeated occurrence of the same biome on different continents?
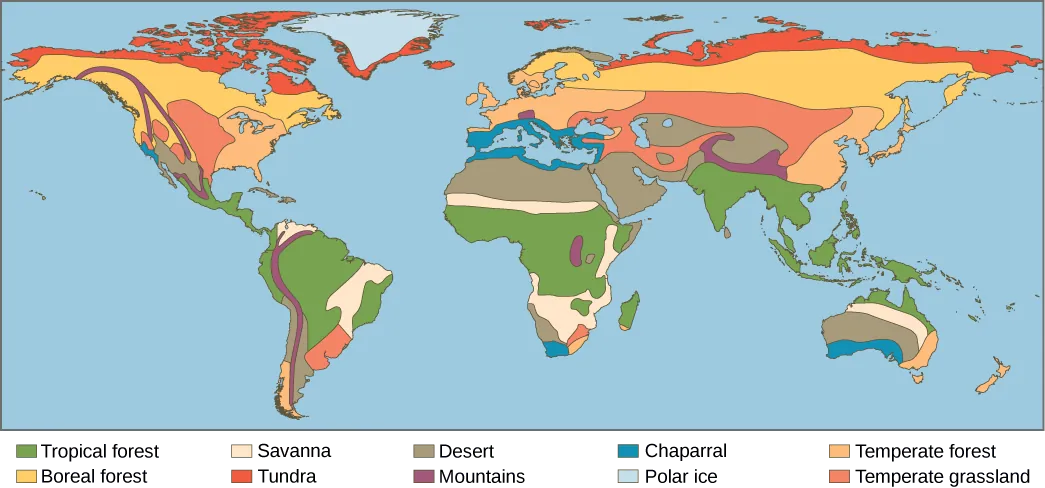
A. Similar climate conditions can produce similar plant and animal communities in different regions.
B. Each biome occurs only where the same species have migrated between continents.
C. Terrestrial biomes are distributed randomly because climate has little effect on ecosystems.
D. The same biome must occur at the same longitude on every continent.
Question 9
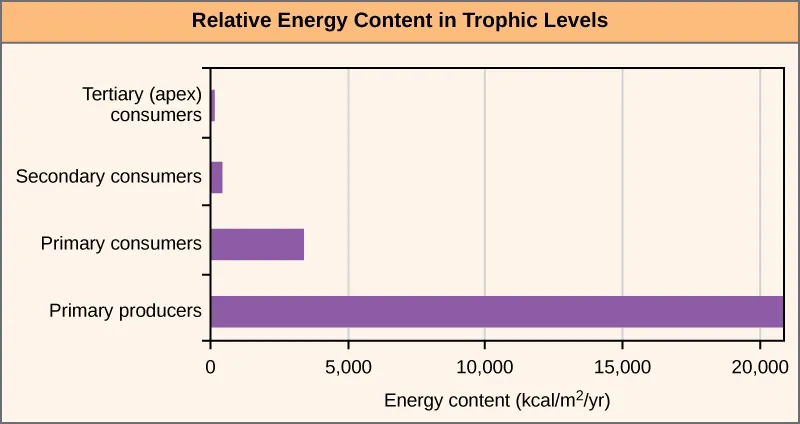
The graph below shows energy available at trophic levels in a freshwater ecosystem. Which claim is best supported by the graph?
A. Energy increases at each higher trophic level because predators store more biomass.
B. Energy decreases at higher trophic levels because much energy is lost during transfer.
C. Energy remains constant because matter is conserved in ecosystems.
D. Energy is lowest in producers because they are consumed by primary consumers.
Question 10
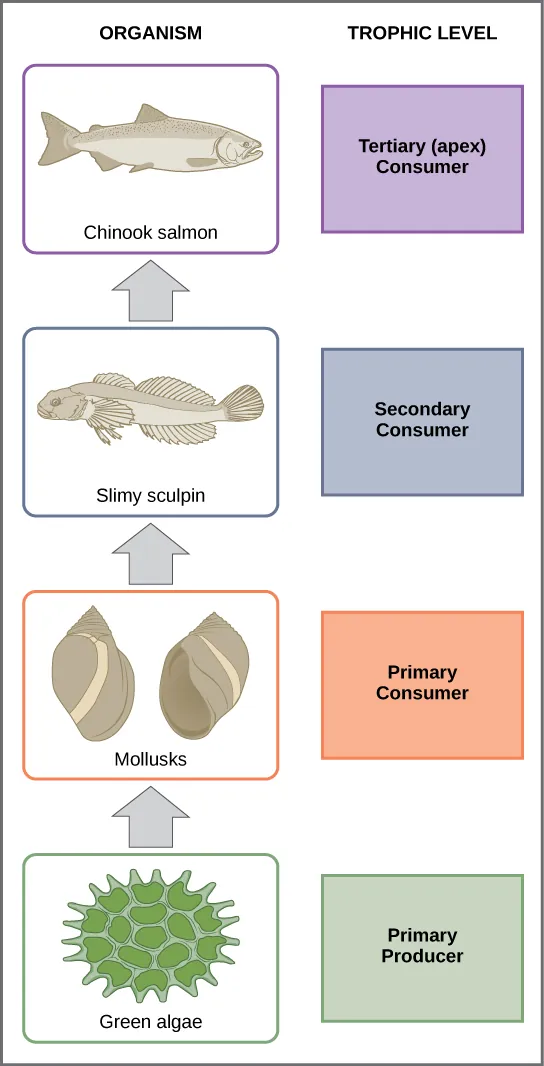
The food chain below shows organisms in a Lake Ontario ecosystem. If the green algae receive of solar energy that is converted into biomass, approximately how much energy would be expected to reach the small fish level under the 10% rule?
A.
B.
C.
D.