

Question 1
Scientists studying island communities often compare rates of immigration and extinction as the number of species present changes. The graph below shows a model of these two rates. Which statement is best supported by the graph below?
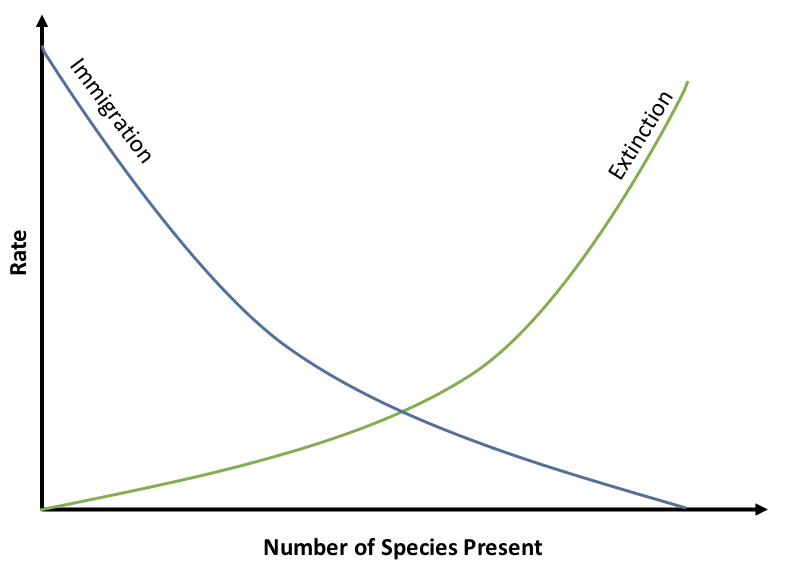
A. Species richness is expected to stabilize where immigration and extinction rates are equal.
B. Species richness increases indefinitely as immigration rates increase.
C. Extinction rates decrease as more species are present on an island.
D. Immigration and extinction rates are unrelated to the number of species present.
Question 2
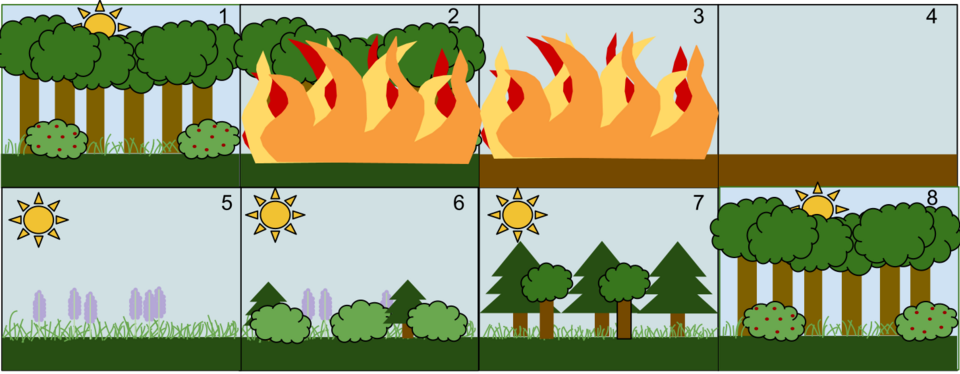
A forested ecosystem is affected by a wildfire, but soil remains in place after the disturbance. The diagram below shows the ecosystem before, during, and after the fire. Which process is most likely represented by the recovery shown?
A. Primary succession, because the ecosystem begins with exposed bare rock
B. Secondary succession, because a disturbance occurs but soil remains
C. Ecological tolerance, because the species shown have identical environmental limits
D. Island biogeography, because new species arrive from a mainland source
Question 3
A field study compared ecosystems with different initial levels of species richness after the same disturbance. Species richness is the number of different species in an ecosystem, and ecosystems with more species are more likely to recover from disruptions. Which conclusion is best supported by the graph below?
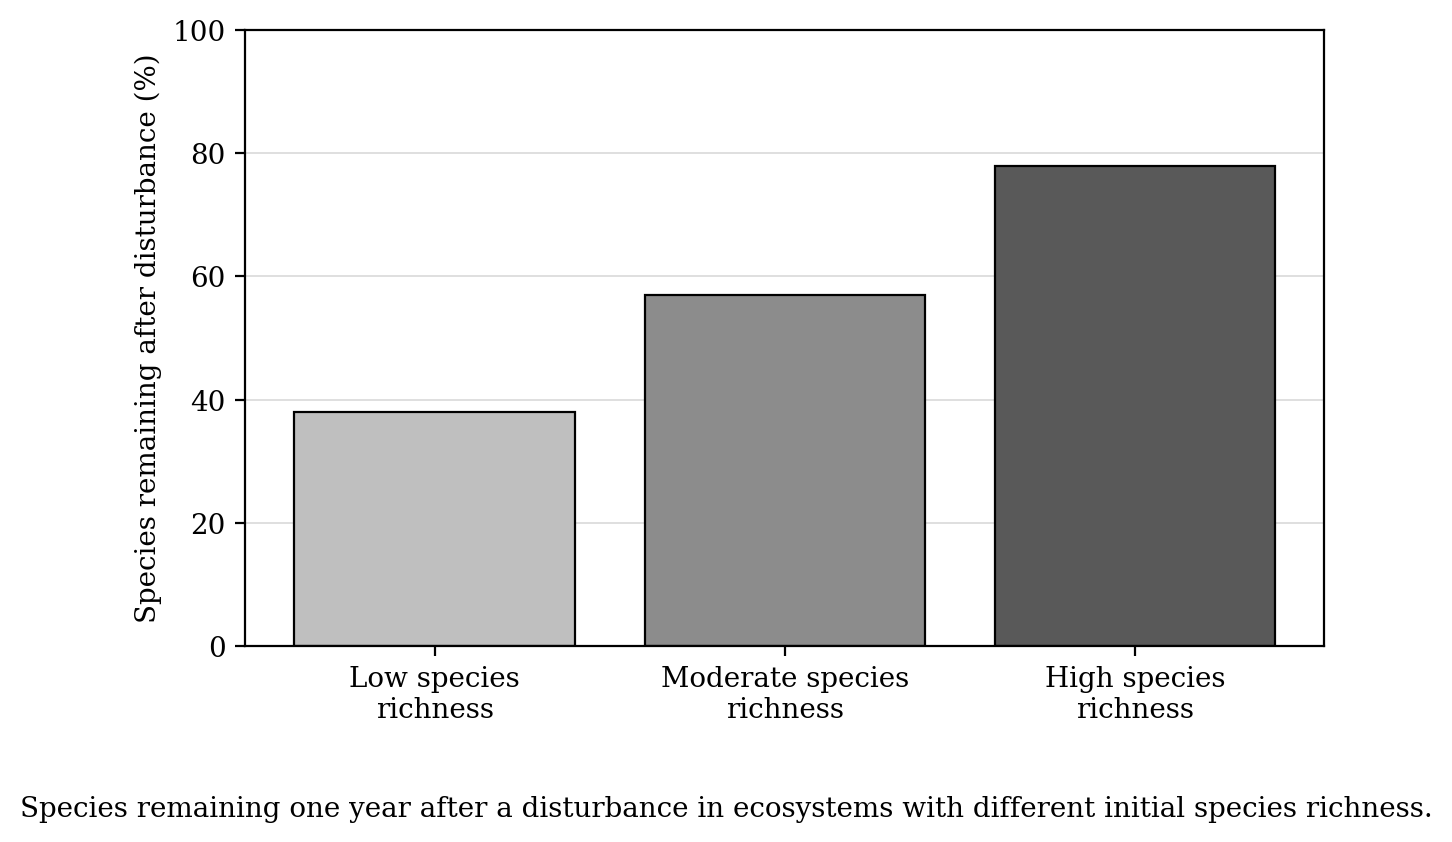
A. Ecosystems with higher species richness had a greater percentage of species remaining after disturbance.
B. Ecosystems with lower species richness had the greatest recovery after disturbance.
C. Species richness had no relationship with the percentage of species remaining.
D. All ecosystems lost the same percentage of species after disturbance.
Question 4
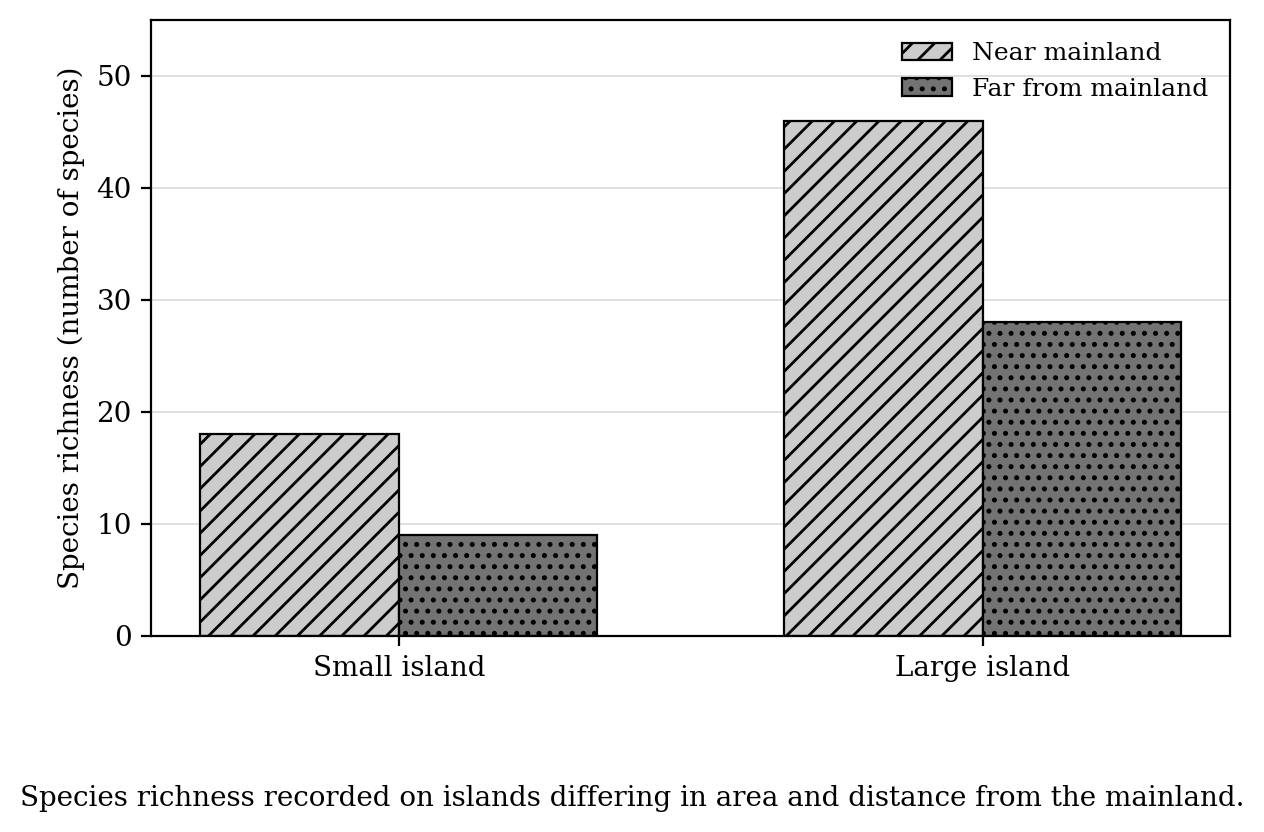
A group of students surveyed species richness on islands that differed in size and distance from the mainland. Island biogeography studies the ecological relationships and distribution of organisms on islands. Based on the bar chart below, which island condition had the highest species richness?
A. Small island near the mainland
B. Small island far from the mainland
C. Large island near the mainland
D. Large island far from the mainland
Question 5
A newly exposed area of land has no developed soil and is gradually colonized by living organisms. The diagram below shows changes in vegetation over time. Which change would most likely occur as the process continues?
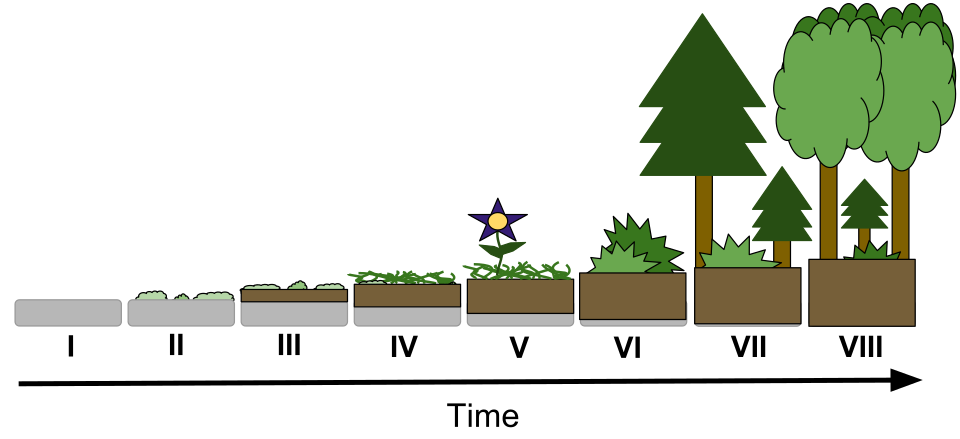
A. Soil depth increases as pioneer organisms contribute organic matter.
B. Species richness immediately drops to zero after trees appear.
C. The community remains unchanged after the first colonizing species arrive.
D. Generalist species are always eliminated before specialist species appear.
Question 6
A shallow pond gradually fills with sediment and plant material. The diagram below shows changes from open water to a more terrestrial habitat. Which conclusion is best supported by the diagram below?
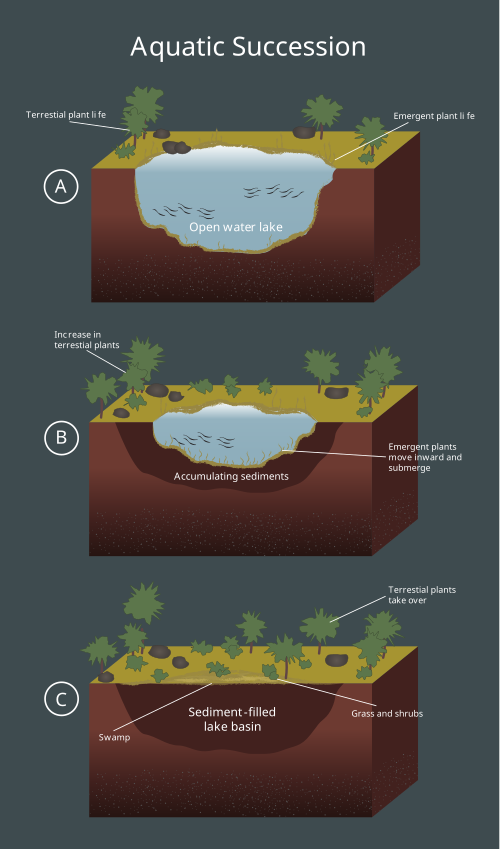
A. Succession can occur in aquatic ecosystems as sediment accumulation changes habitat conditions.
B. Succession only occurs after wildfire removes a mature forest community.
C. Aquatic ecosystems cannot develop pioneer communities.
D. Species richness must remain constant as a pond fills with sediment.
Question 7
The photograph below shows a salt marsh, a coastal wetland ecosystem. Based on the source shown, which ecosystem service would most directly result from the vegetation and shallow water in this habitat?
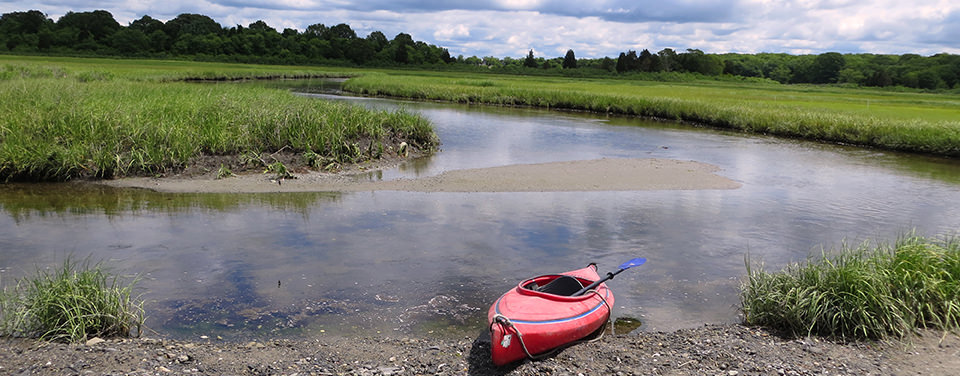
A. Reducing shoreline erosion by buffering wave action
B. Increasing glacier volume by storing snow and ice
C. Preventing all migration by wildlife after disturbance
D. Eliminating the need for biodiversity in the ecosystem
Question 8
The photograph and graph below show evidence of glacial retreat over time. Which statement best describes the environmental significance of the trend shown?
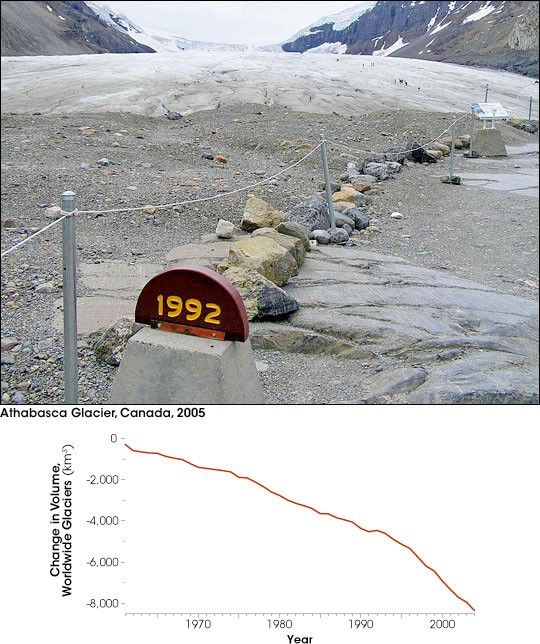
A. Long-term climate change can alter habitats by reducing ice-covered areas.
B. Glacial retreat prevents sea level from changing over geological time.
C. Glaciers retreat only after human-made disturbances remove soil.
D. Glacier loss increases genetic diversity in every affected population.
Question 9
The map below shows changes in the area of marine-terminating glaciers from 2000 to 2020. Which claim is best supported by the pattern shown?
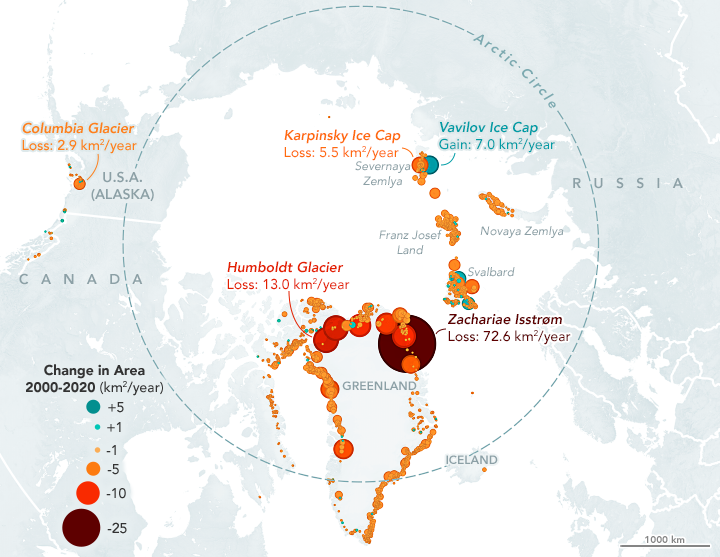
A. Most mapped glacier-front changes show area loss rather than area gain.
B. All glaciers shown gained area at the same rate.
C. The largest changes occurred only in tropical ecosystems.
D. Glacier retreat is unrelated to long-term habitat change.
Question 10
The chart below compares the share of known species threatened with extinction across major taxonomic groups. Which conclusion is most directly supported by the chart below?
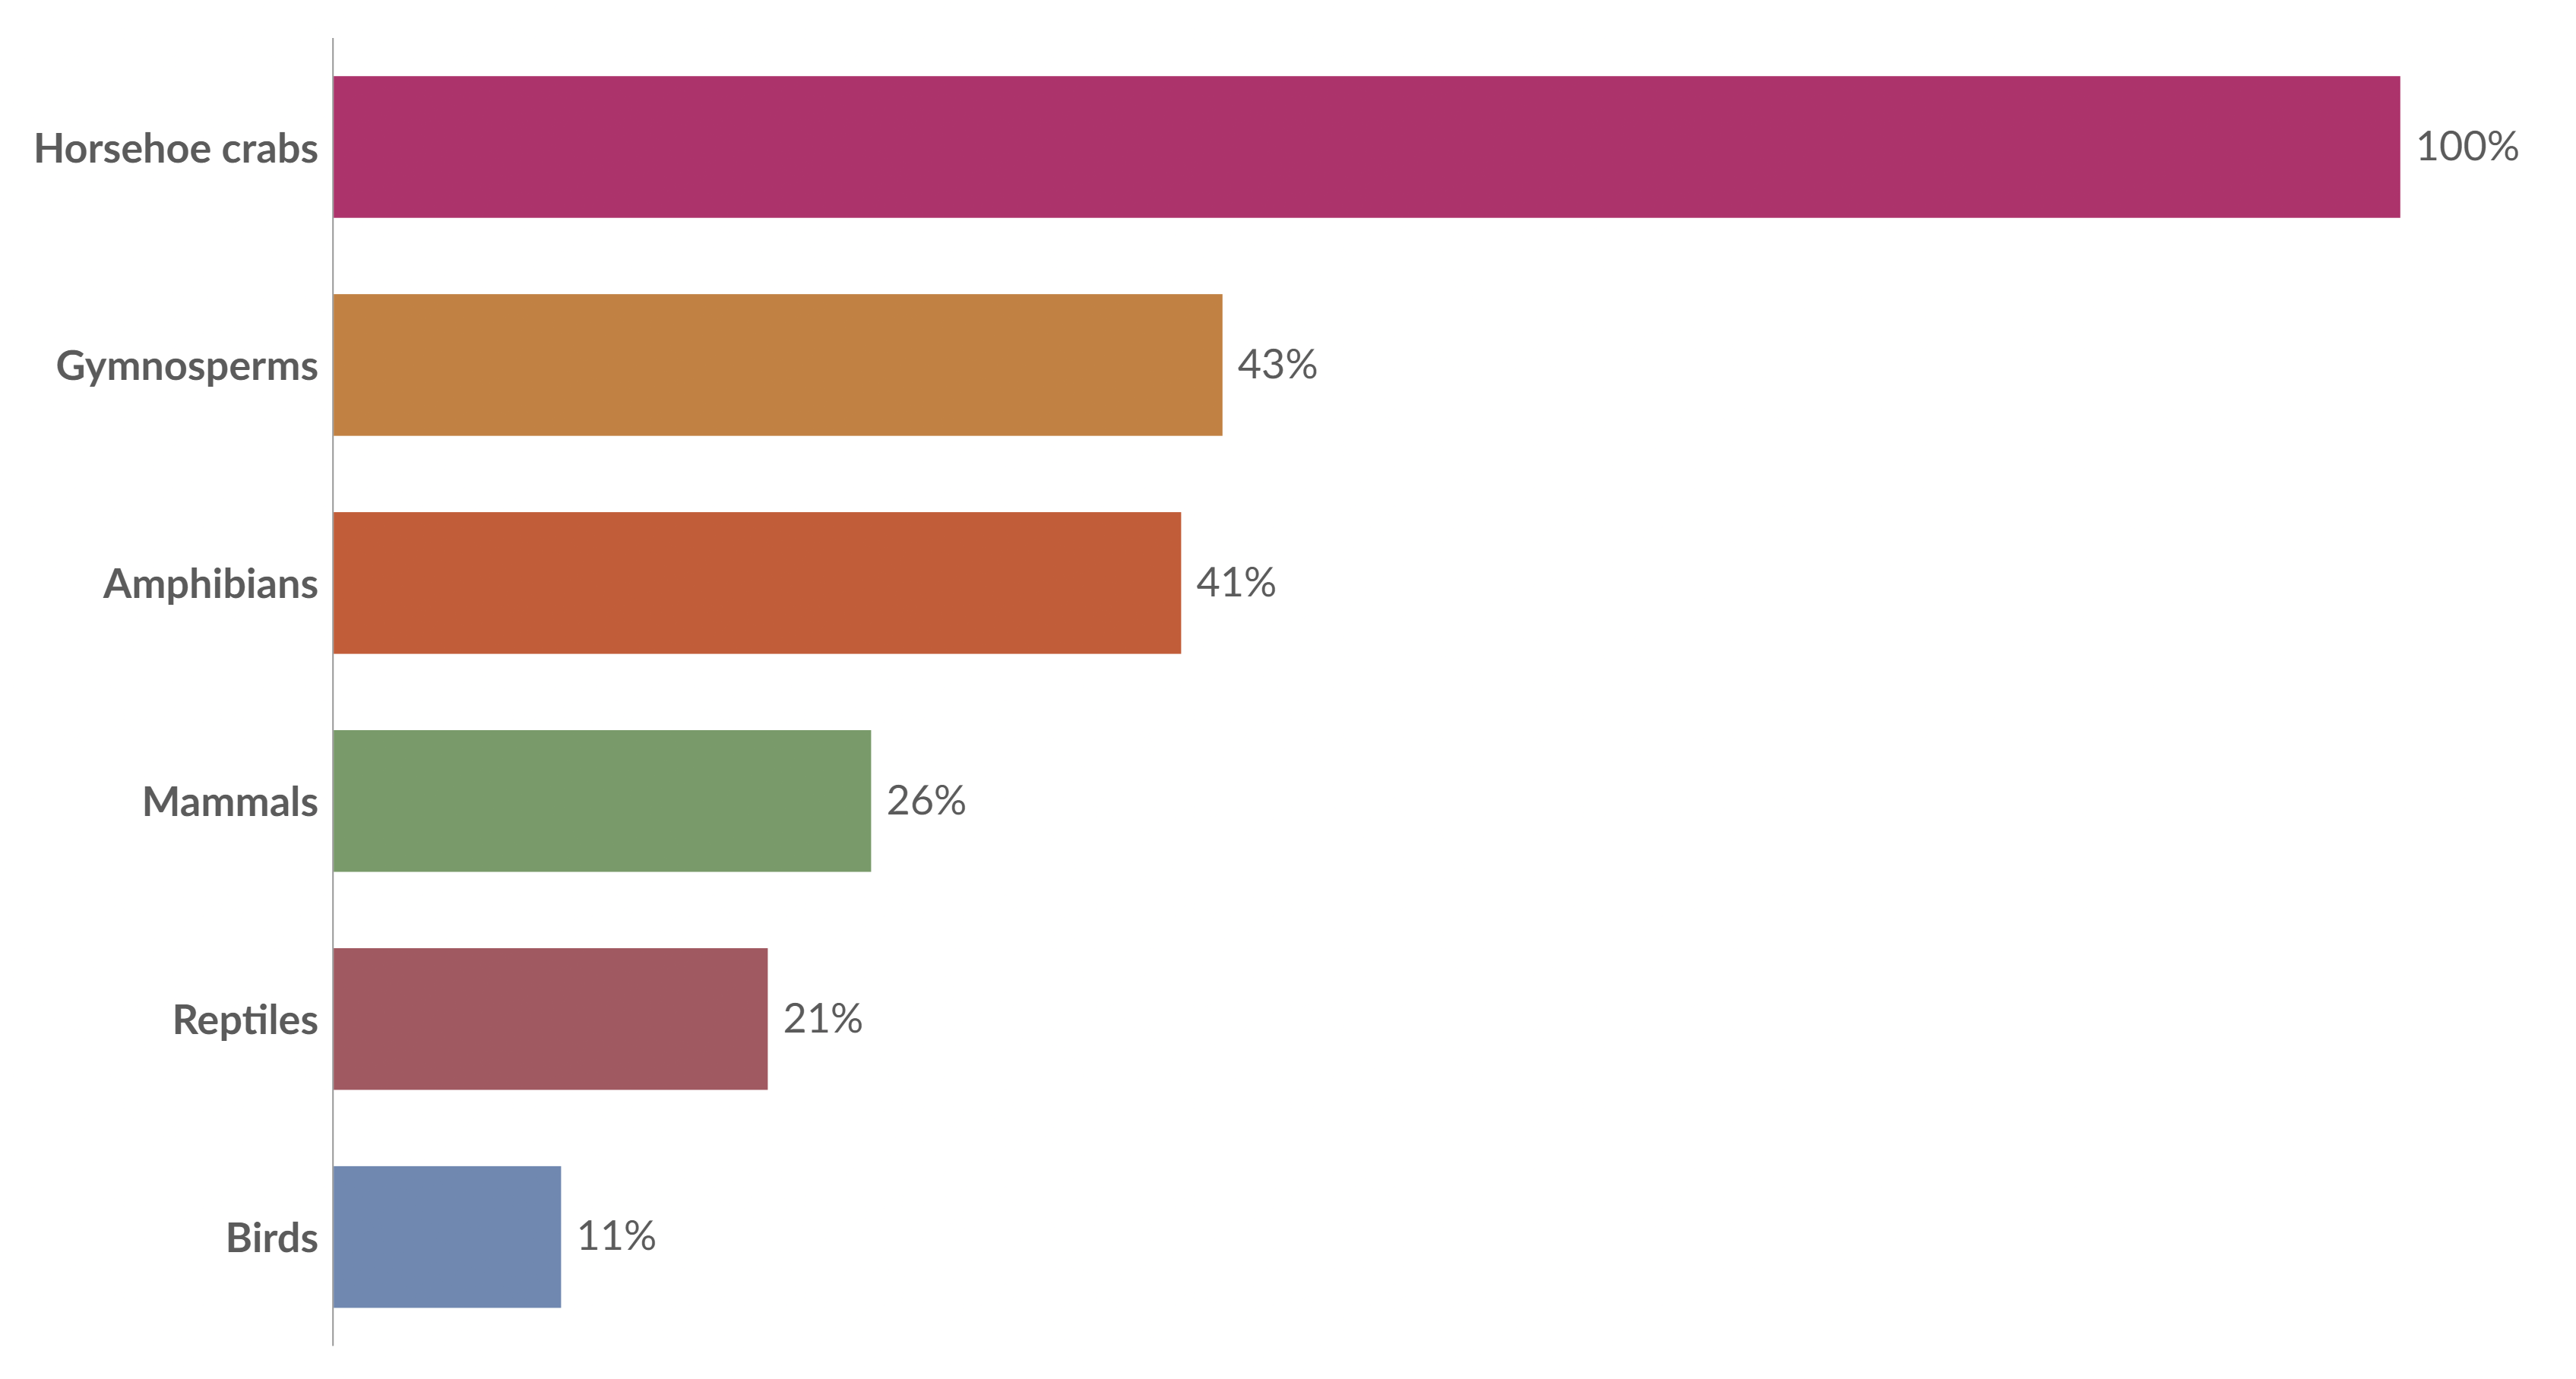
A. Threatened status varies among taxonomic groups.
B. All groups have the same level of extinction risk.
C. Species richness is the same as genetic diversity.
D. Extinction risk can be determined without evaluating species.