

Question 1
A hypothetical values survey investigated how three social groups prioritised environmental protection and economic growth. Each respondent selected one statement that most closely represented their perspective.
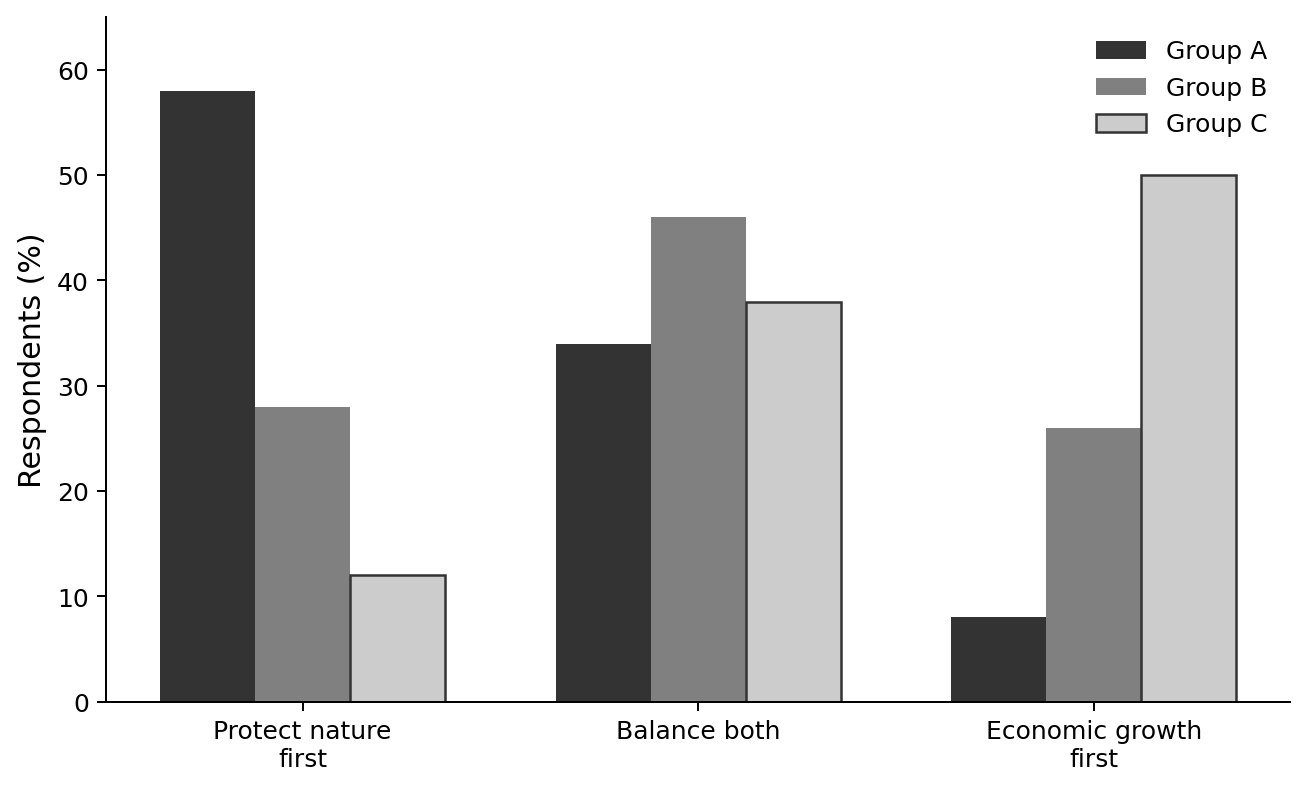
Compare the dominant response in Groups A, B and C.
Explain how the graph illustrates the relationship between values and environmental perspectives.
Evaluate the usefulness of this values survey for understanding the perspectives of the three groups.
Question 2
A hypothetical NGO ran a campaign encouraging lower meat consumption. A survey recorded the percentage of participants choosing low-meat meals each week. The campaign began between weeks and .
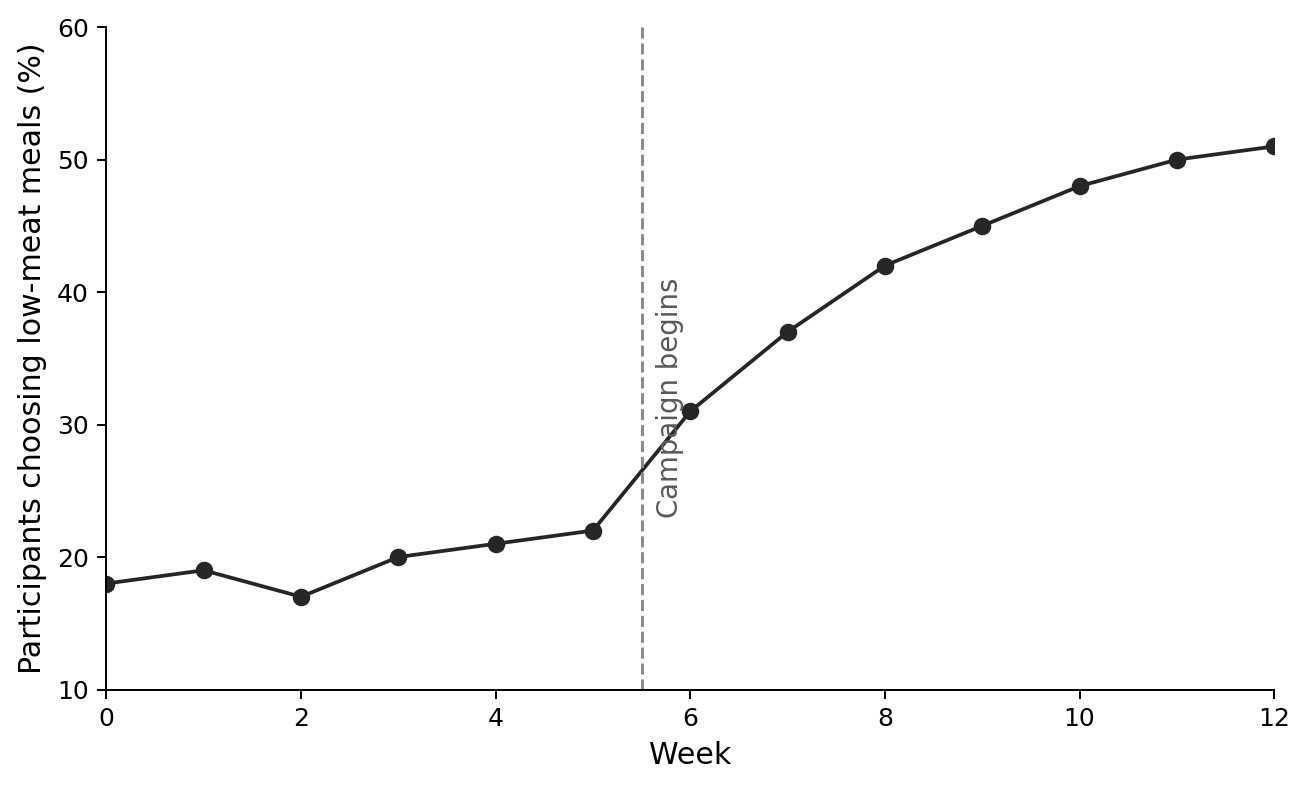
Describe the pattern in behaviour before and after the campaign began.
Calculate the increase in participants choosing low-meat meals between week and week .
Discuss the extent to which the graph supports the claim that the campaign changed participants' perspectives and behaviour.
Question 3
A hypothetical community survey classified respondents into broad environmental perspective categories over six survey years.
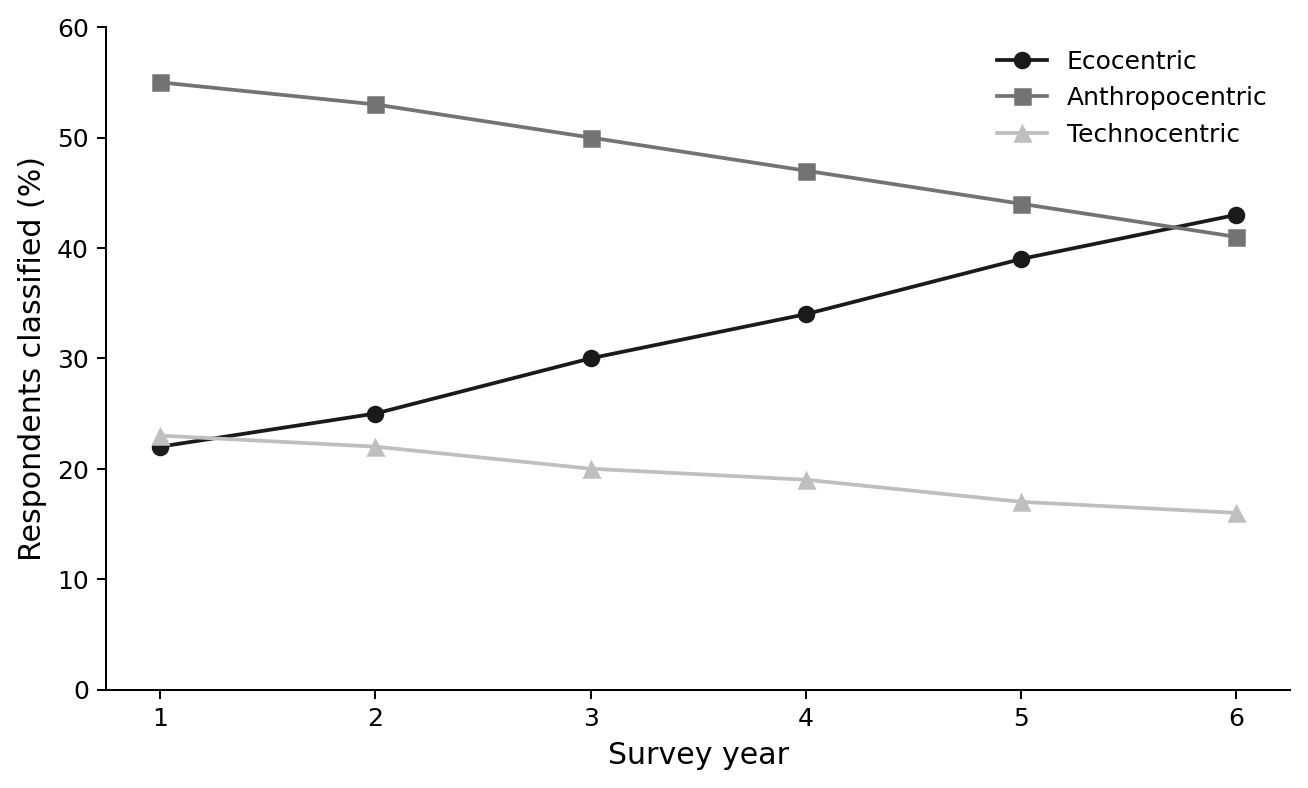
Describe how the three classified perspectives changed during the survey period.
Explain why the data support the idea that environmental perspectives may change over time.
Explain one use and two limitations of classifying people as ecocentric, anthropocentric or technocentric.
Question 4
The photograph below shows people participating in an environmental demonstration. The banner communicates a position about the relative importance of environmental and economic priorities.

Identify two priorities or values communicated by the banner in the photograph.
Explain how values and perspectives may contribute to the action shown in the photograph.
Discuss why the photograph alone would be insufficient evidence to classify all of the demonstrators as having one particular environmental worldview.
Question 5
The photograph below shows Biosphere 2, a constructed facility containing enclosed environments. In ESS it can be considered as an example approximating a closed system: matter exchange across the system boundary is restricted, while energy can cross the boundary.
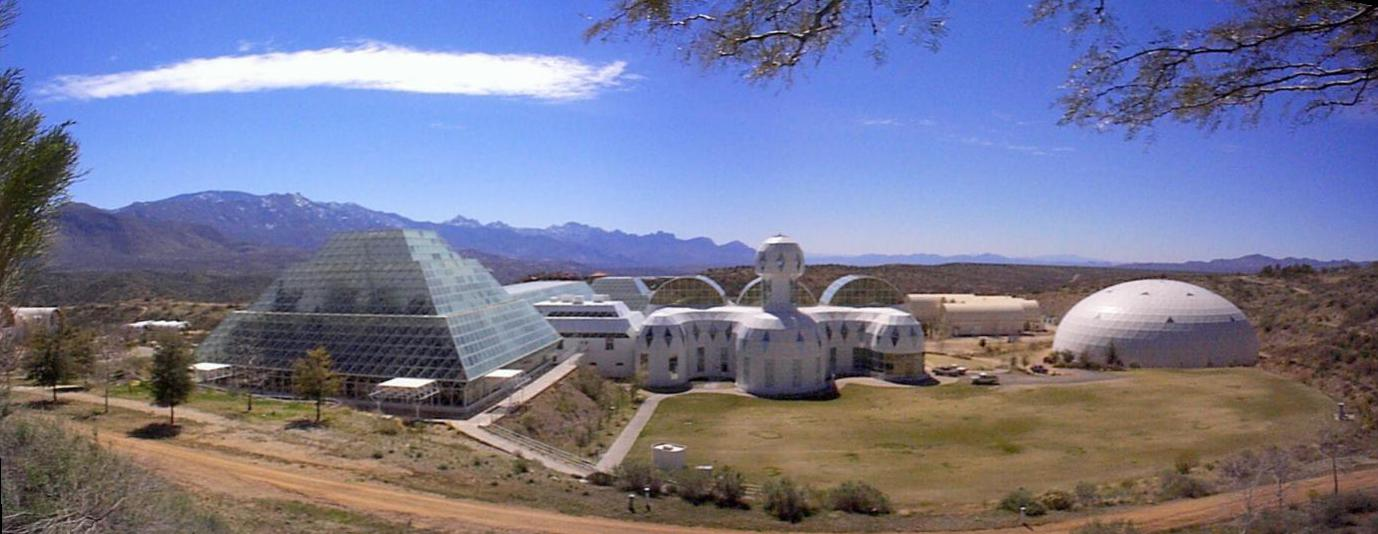
Using the photograph, identify:
one visible feature that could form part of the physical system boundary;
one energy input that could cross this boundary.
Explain the difference between an open system and a closed system, applying your answer to Biosphere 2.
Evaluate the usefulness and limitations of using a facility such as the one shown as a model of a natural ecosystem.
Question 6
The satellite image below shows a large algal bloom within part of a lake. In a simplified systems model, a change in nutrient concentrations may cause a lake system to shift from one stable state to another.

Describe two visible features showing that conditions within the lake are spatially uneven.
Explain how the concept of a tipping point could be applied to a hypothetical change in nutrient concentration in this lake system.
Evaluate whether this single satellite image provides sufficient evidence to conclude that the lake has crossed a tipping point.
Question 7
The satellite image below shows forest clearance associated with a branching network of roads. System resilience is the capacity of a system to resist damage and recover from, or adapt efficiently to, disturbance.
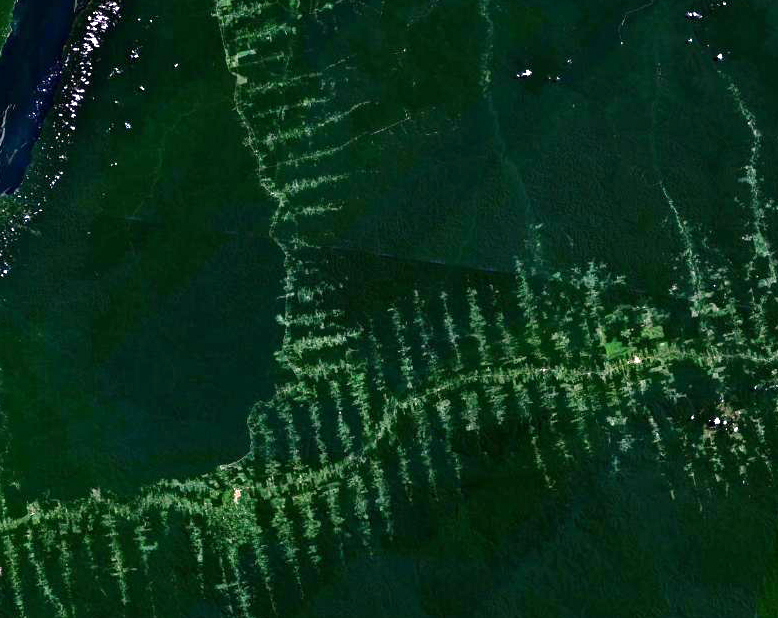
Describe two features of the land-use pattern visible in the satellite image.
Explain how the changes visible in the image could reduce the resilience of the forest system.
Using the concept of storage size, suggest why a large continuous forest system may respond differently to disturbance from a much smaller remaining forest area.
Question 8
The diagram below shows three ways of representing relationships between the environmental, social and economic dimensions of sustainability.
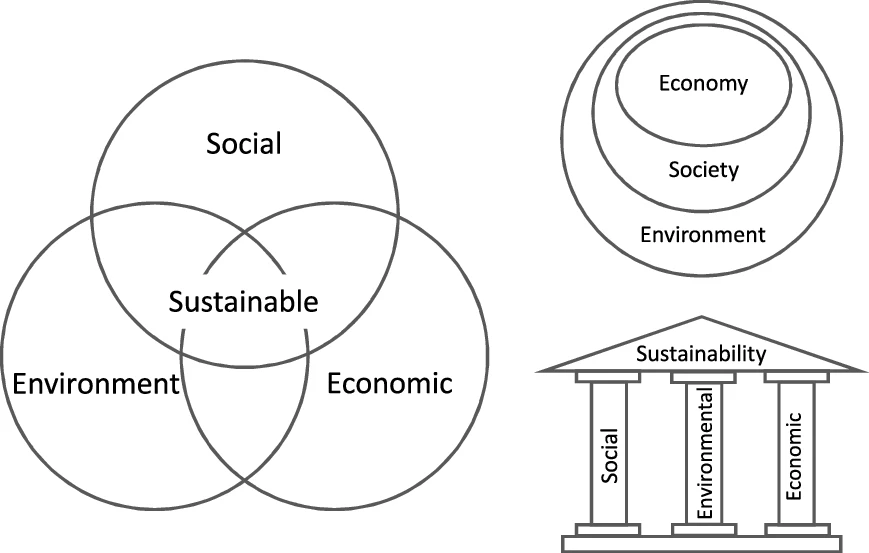
Identify which of the following representations in the visual most closely corresponds to:
Choose from the intersecting-circle model on the left and the nested-circle model at the upper right.
weak sustainability;
strong sustainability.
Explain why the nested-circle representation is consistent with strong sustainability.
Evaluate the usefulness and one limitation of models such as those shown for understanding sustainability.
Question 9
The photograph below shows members of a community group protesting near a coal-fired power plant. Assume that local residents, the operator of the facility and local government are stakeholders in decisions concerning the site.

Identify two pieces of visible evidence that indicate stakeholder concern or opposition.
Explain how the situation represented by the photograph could be considered using the concept of environmental justice.
Analyse why local residents and other stakeholders might develop different perspectives towards the facility.
Question 10
The map below classifies countries according to whether their ecological footprint is within their ecological means or is in ecological overshoot. Green shading represents ecological reserve, while red shading represents ecological deficit or overshoot.
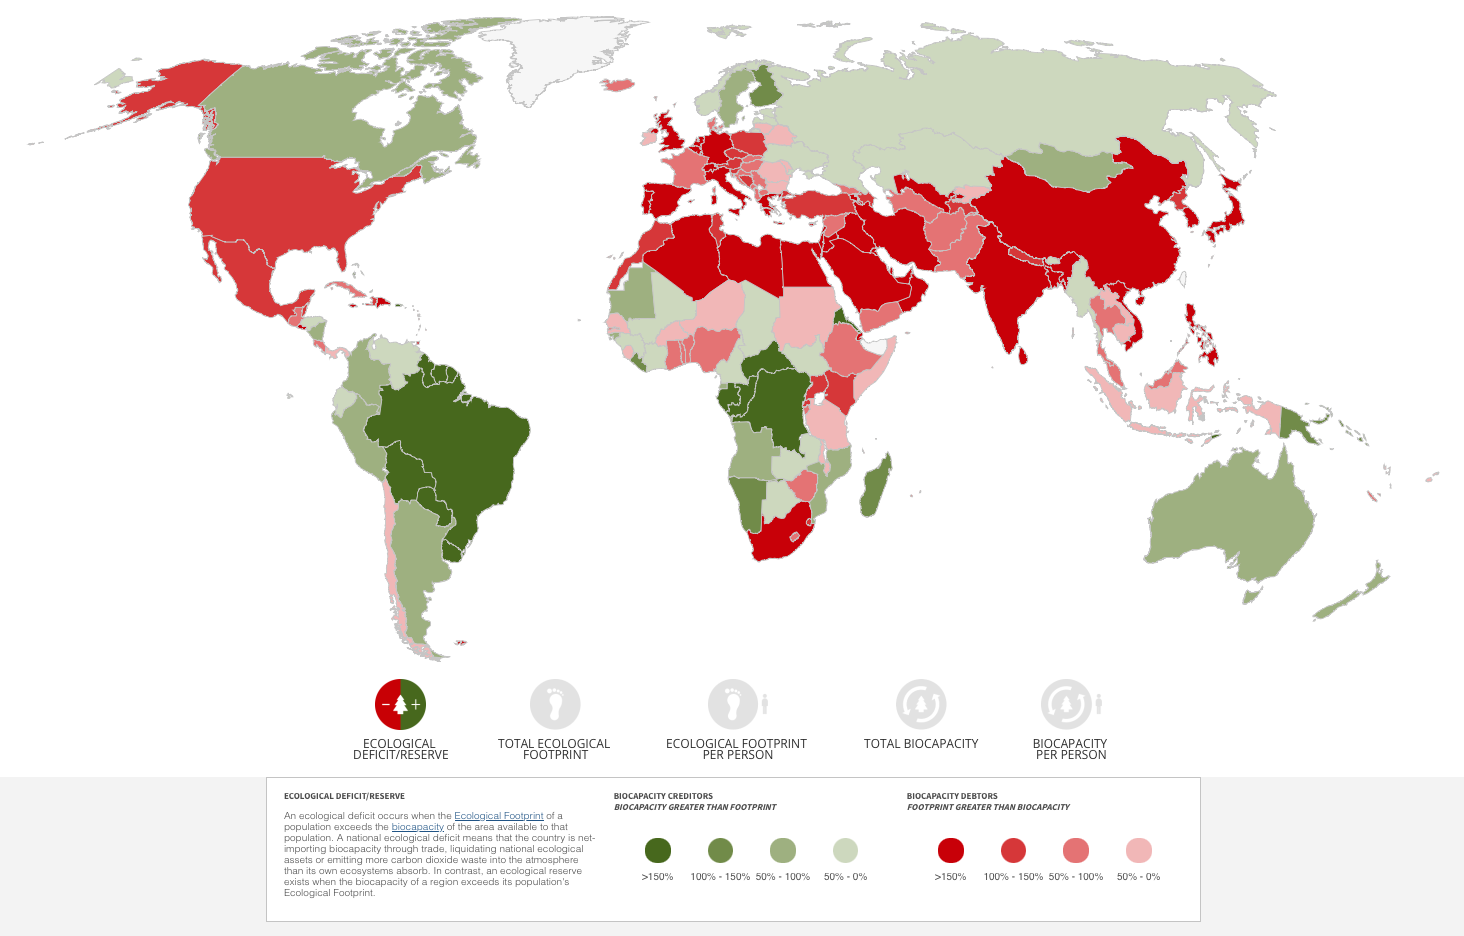
Describe two broad spatial patterns visible on the map.
Explain why ecological overshoot indicates that a population is operating unsustainably.
Evaluate the usefulness and limitations of the map as an indicator of sustainability.