

Question 1
A hypothetical investigation measured change in body mass and the increase in heart rate during prolonged steady-state submaximal exercise. Which interpretation best applies the syllabus concept of cardiovascular drift to the results?
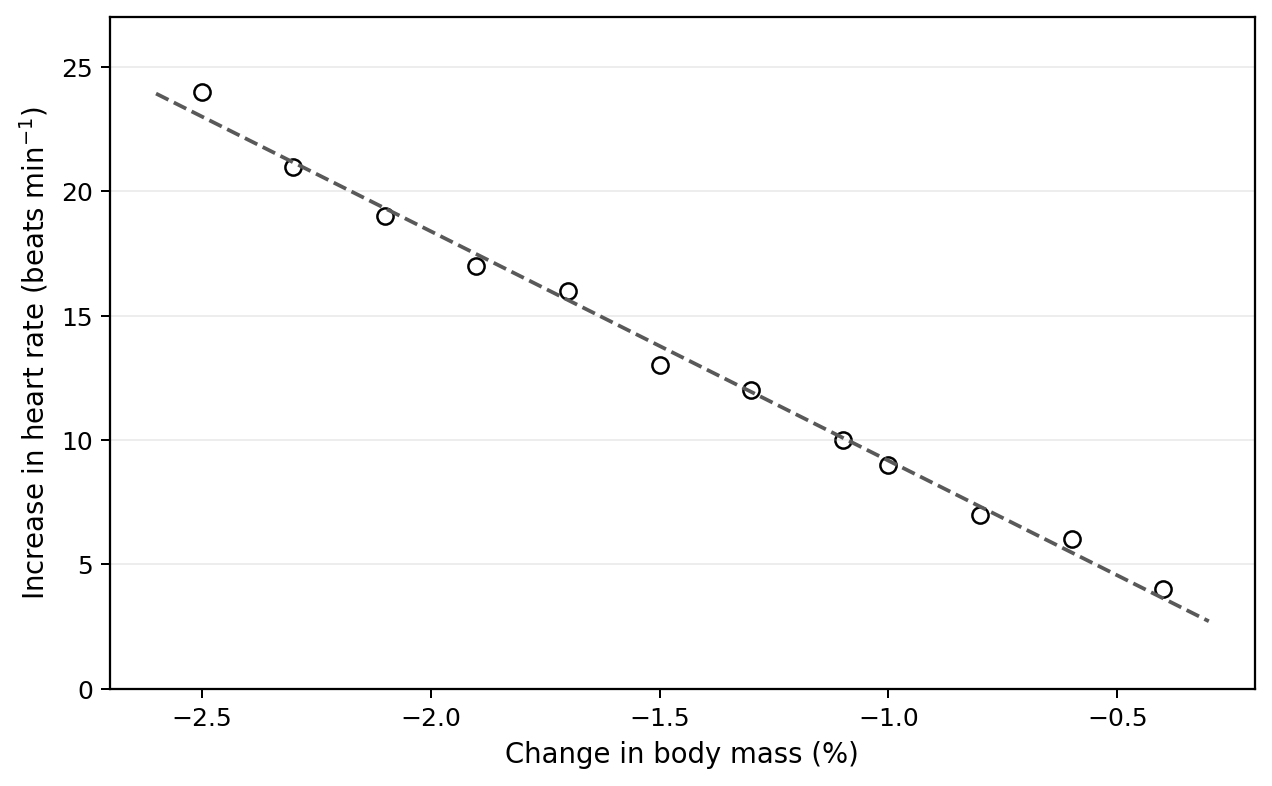
A. Greater body-mass loss is associated with a smaller cardiovascular drift.
B. Greater body-mass loss is associated with a greater cardiovascular drift, which is consistent with water loss contributing to cardiovascular drift.
C. Heart-rate increases prove that changes in urine osmolarity caused the water loss.
D. Cardiovascular drift can occur only when body mass remains unchanged.
Question 2
Higher urine-colour scores represent darker urine. Which conclusion best combines the graph with the syllabus description of methods for assessing water and electrolyte balance?
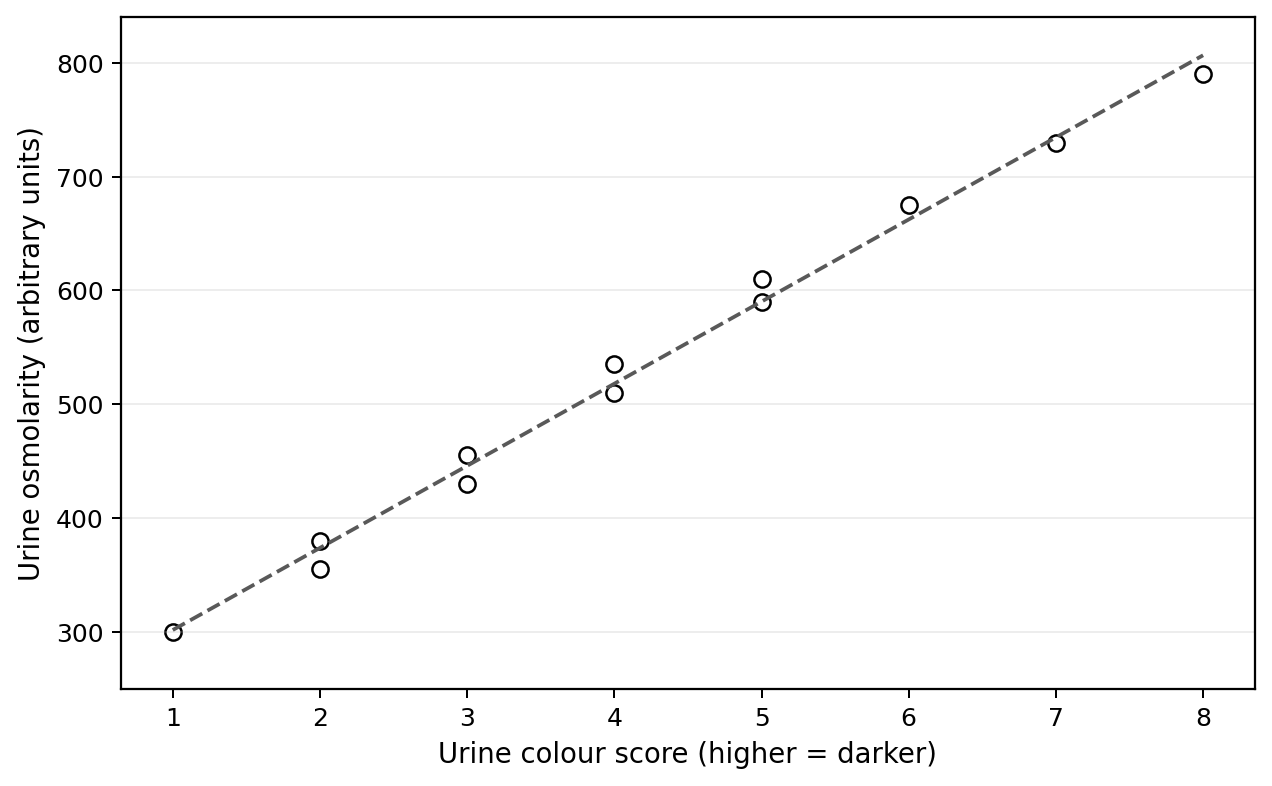
A. Urine colour and urine osmolarity change in a consistent direction and may therefore provide complementary evidence when assessing water and electrolyte balance.
B. Urine colour is unrelated to urine osmolarity and should never be used to assess water balance.
C. The graph proves that darker urine directly causes higher osmolarity.
D. Only body weight can be used to assess water and electrolyte balance.
Question 3
A hypothetical student investigation measured heart rate during the same prolonged, steady-state submaximal exercise in thermoneutral and hot conditions. The syllabus identifies water loss and increased core body temperature as causes of cardiovascular drift during this type of exercise.
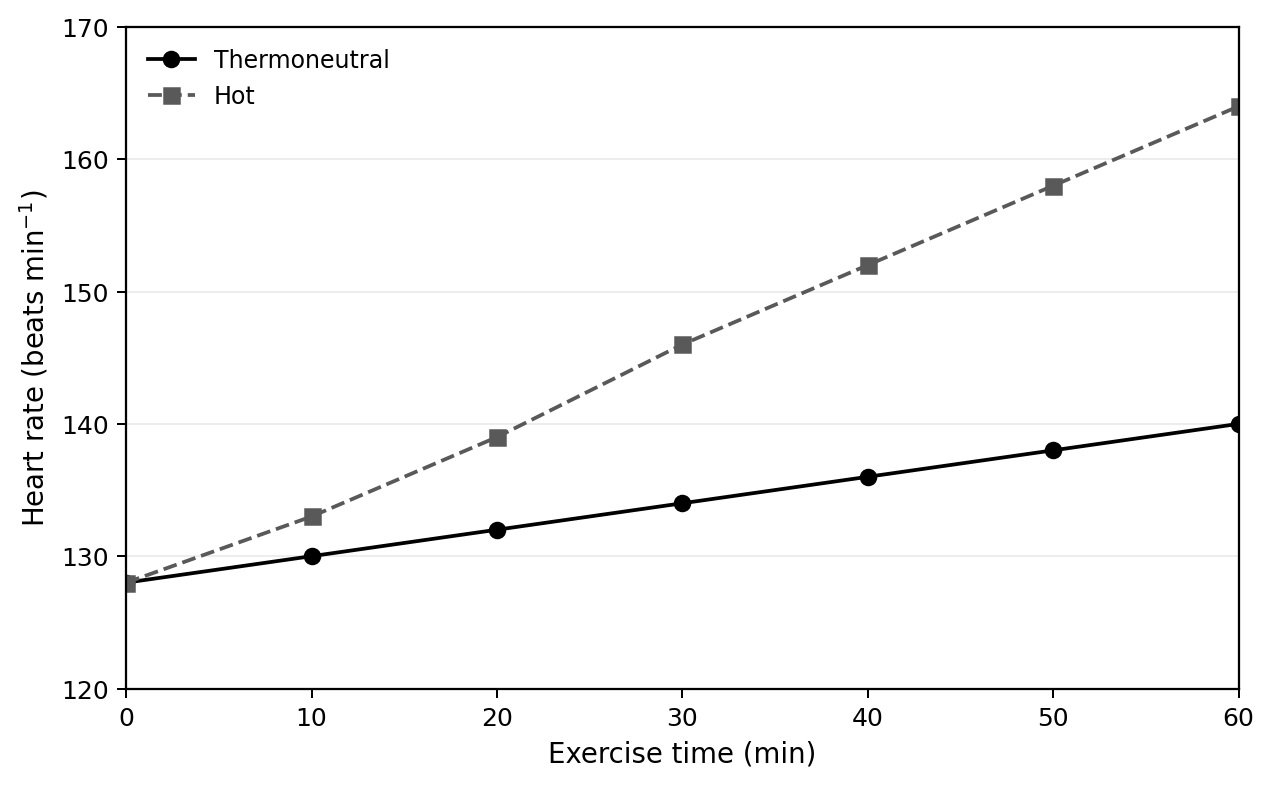
Calculate the increase in heart rate between and in each environmental condition. Compare the two changes.
Explain the greater cardiovascular drift observed in the hot condition.
Suggest one additional measurement that could be taken before and after exercise to assess water and electrolyte balance. Explain how the measurement would complement the heart-rate data.
Question 4
In a hypothetical investigation, participants completed prolonged exercise. Change in body mass and post-exercise urine osmolarity were measured as indicators of water and electrolyte balance. Both body weight and urine osmolarity are identified in the syllabus as possible measures of water and electrolyte balance.
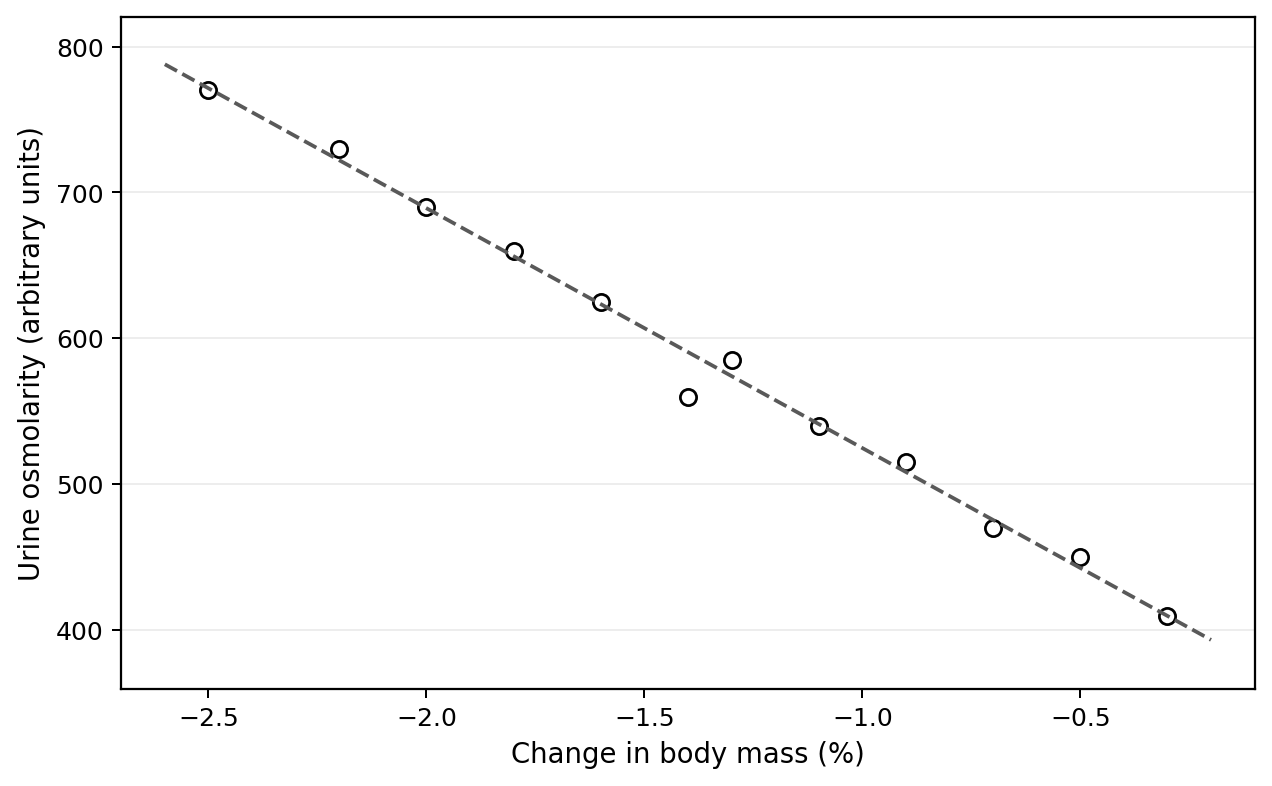
Analyse the relationship between change in body mass and urine osmolarity.
Estimate the urine osmolarity expected for a participant whose body mass changes by .
Evaluate the claim that these data prove that the change in body mass caused the change in urine osmolarity.
Question 5
The photograph below shows a distance runner taking fluid during prolonged, steady-state submaximal exercise in a hot environment. For this question, assume that the bottle contains water only.
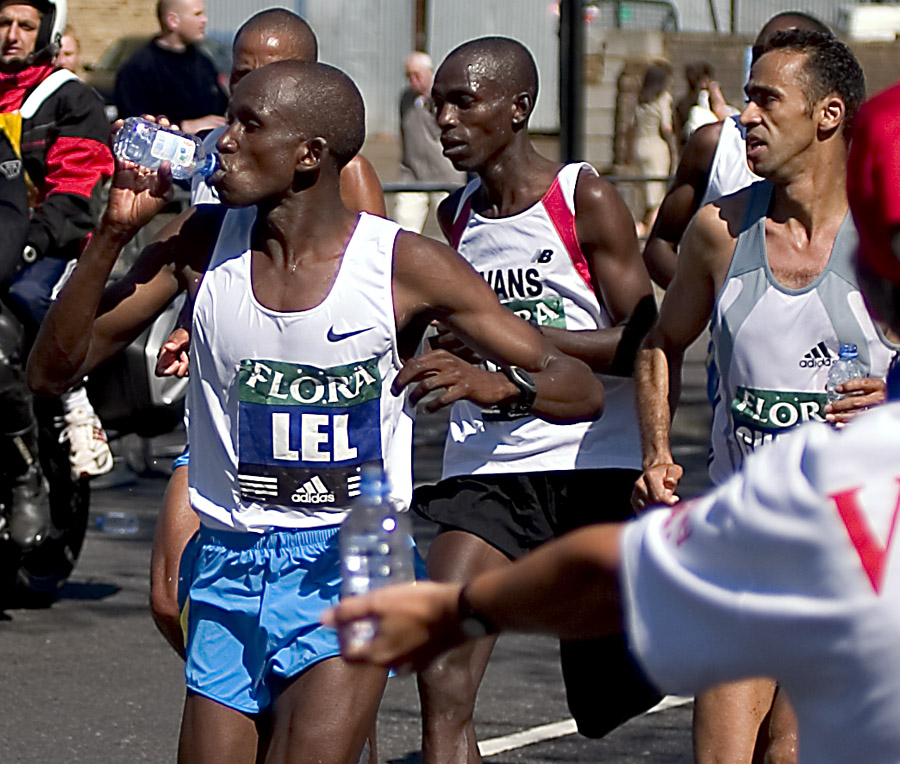
Using evidence from the photograph, identify the action being taken to support hydration. Describe two routes by which water or electrolytes may be lost from the body during prolonged exercise.
Explain how failure to maintain water and electrolyte balance could affect health and sporting performance. Name two states that may occur when this balance is not maintained.
Explain why cardiovascular drift could develop during the exercise situation shown in the photograph.
Question 6
The photograph below shows the type of equipment used to measure body weight. In a hypothetical student investigation, the same participant and scale were used immediately before and after prolonged exercise. Body mass was before exercise and afterwards.
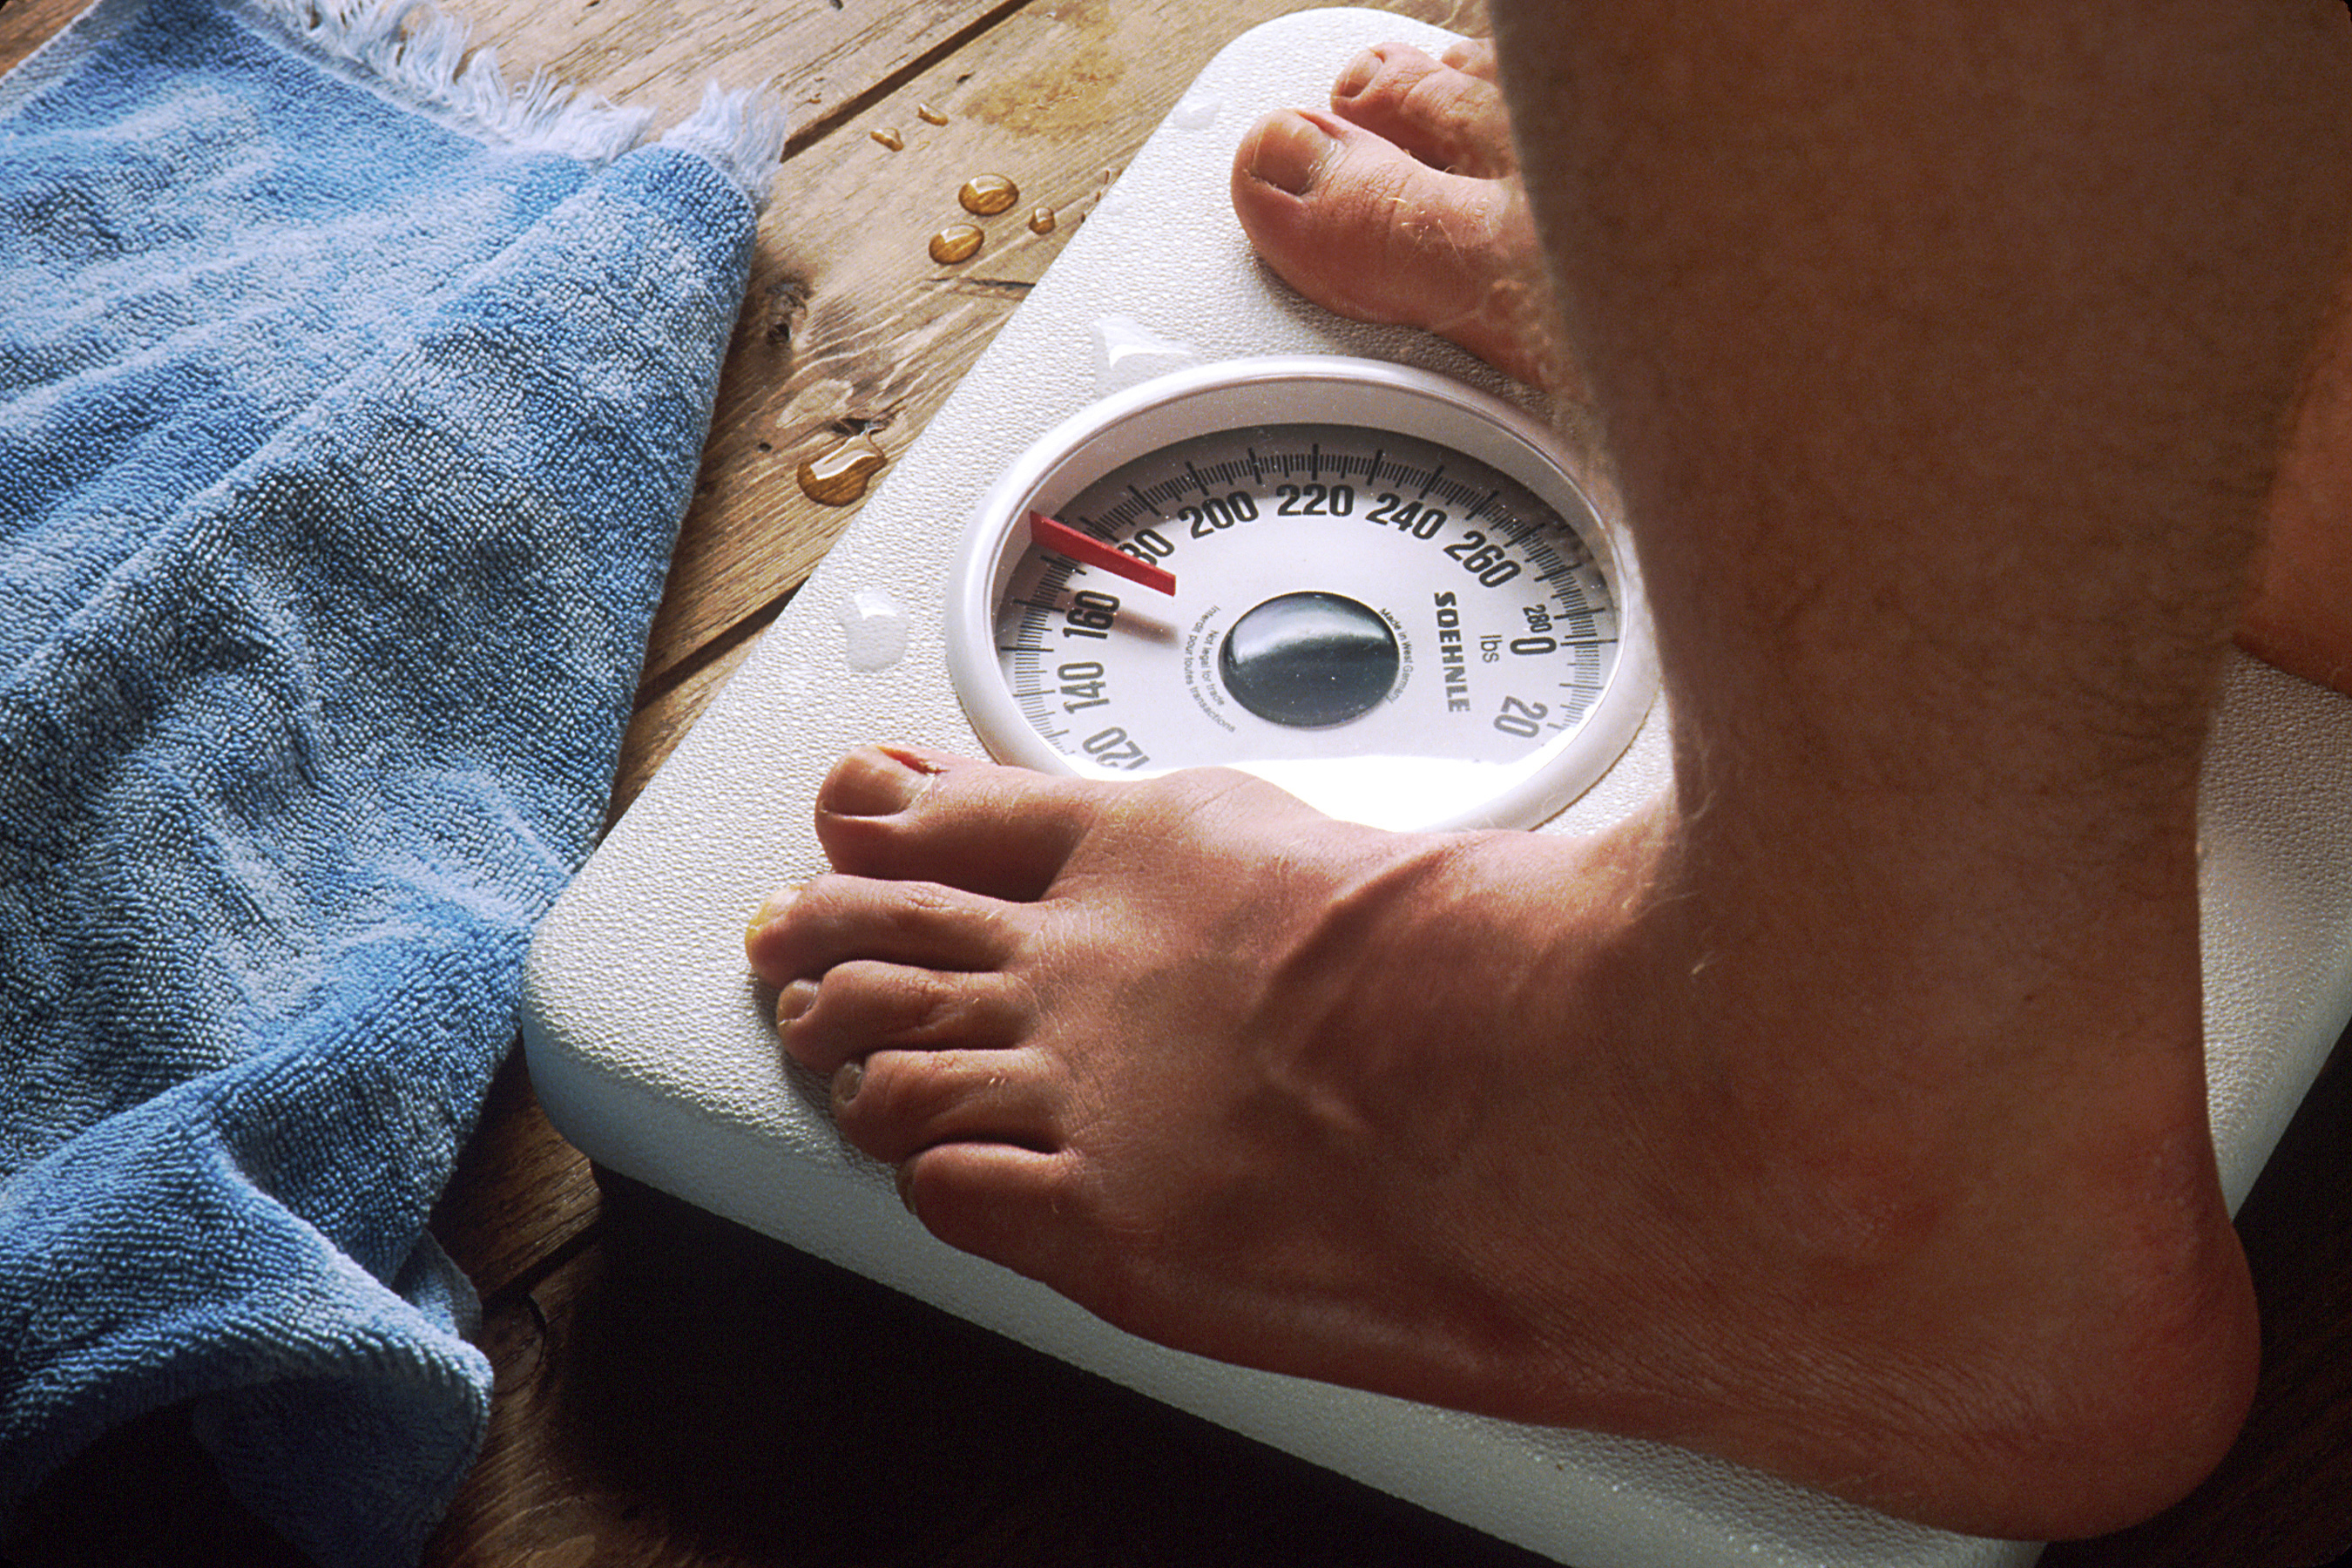
Identify the method of assessing water and electrolyte balance represented by the photograph. State two other methods identified in the SEHS syllabus.
Calculate the percentage change in the participant's body mass from before to after exercise.
Interpret the result in relation to water balance. Explain why this measurement alone cannot determine whether the participant is experiencing dehydration, hypernatremia or hyponatremia.
Suggest one additional syllabus measurement that could be collected to strengthen the investigation's assessment of water and electrolyte balance.
Question 7
Which set contains three states that can occur when water and electrolyte balance is not maintained?
A. Dehydration, hypoglycaemia and hyperthermia
B. Hypernatremia, hypoglycaemia and dehydration
C. Hyponatremia, hyperthermia and hypoglycaemia
D. Dehydration, hypernatremia and hyponatremia
Question 8
The image below shows a food and its nutritional information. Use the masses of total carbohydrate, protein and total fat per serving shown on the label. Calorie calculations are not required.
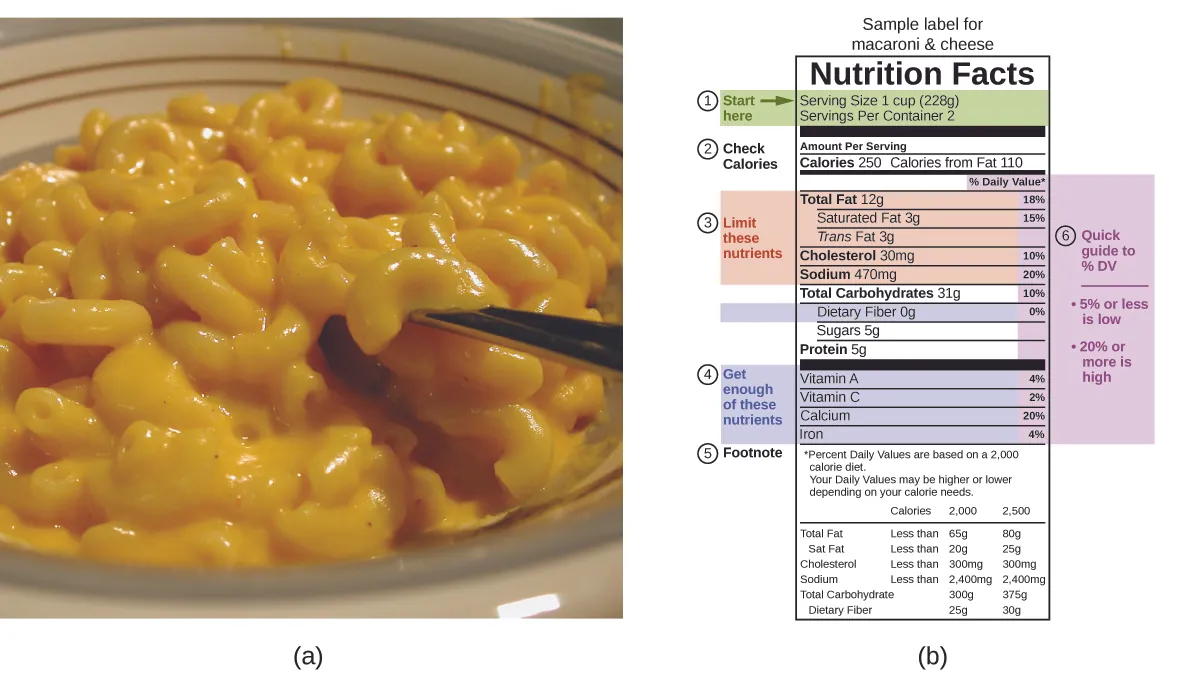
Using the label, state the mass per serving of carbohydrate, protein and fat. Identify which of the three macronutrients is present in the greatest mass.
Explain why the information visible in the image is insufficient, by itself, to decide whether this food would be an appropriate pre-exercise choice for every sportsperson.
A sportsperson considers consuming this food during exercise. Using evidence from the image and SEHS knowledge, explain one potential benefit and one consideration that should influence this decision.
A coach claims that because the food contains all three macronutrients, regularly consuming it means an athlete cannot develop low energy availability (LEA) or relative energy deficiency in sport (RED-S). Evaluate this claim.
Question 9
The photograph below shows athletes in starting blocks immediately before a short, high-intensity sprint.
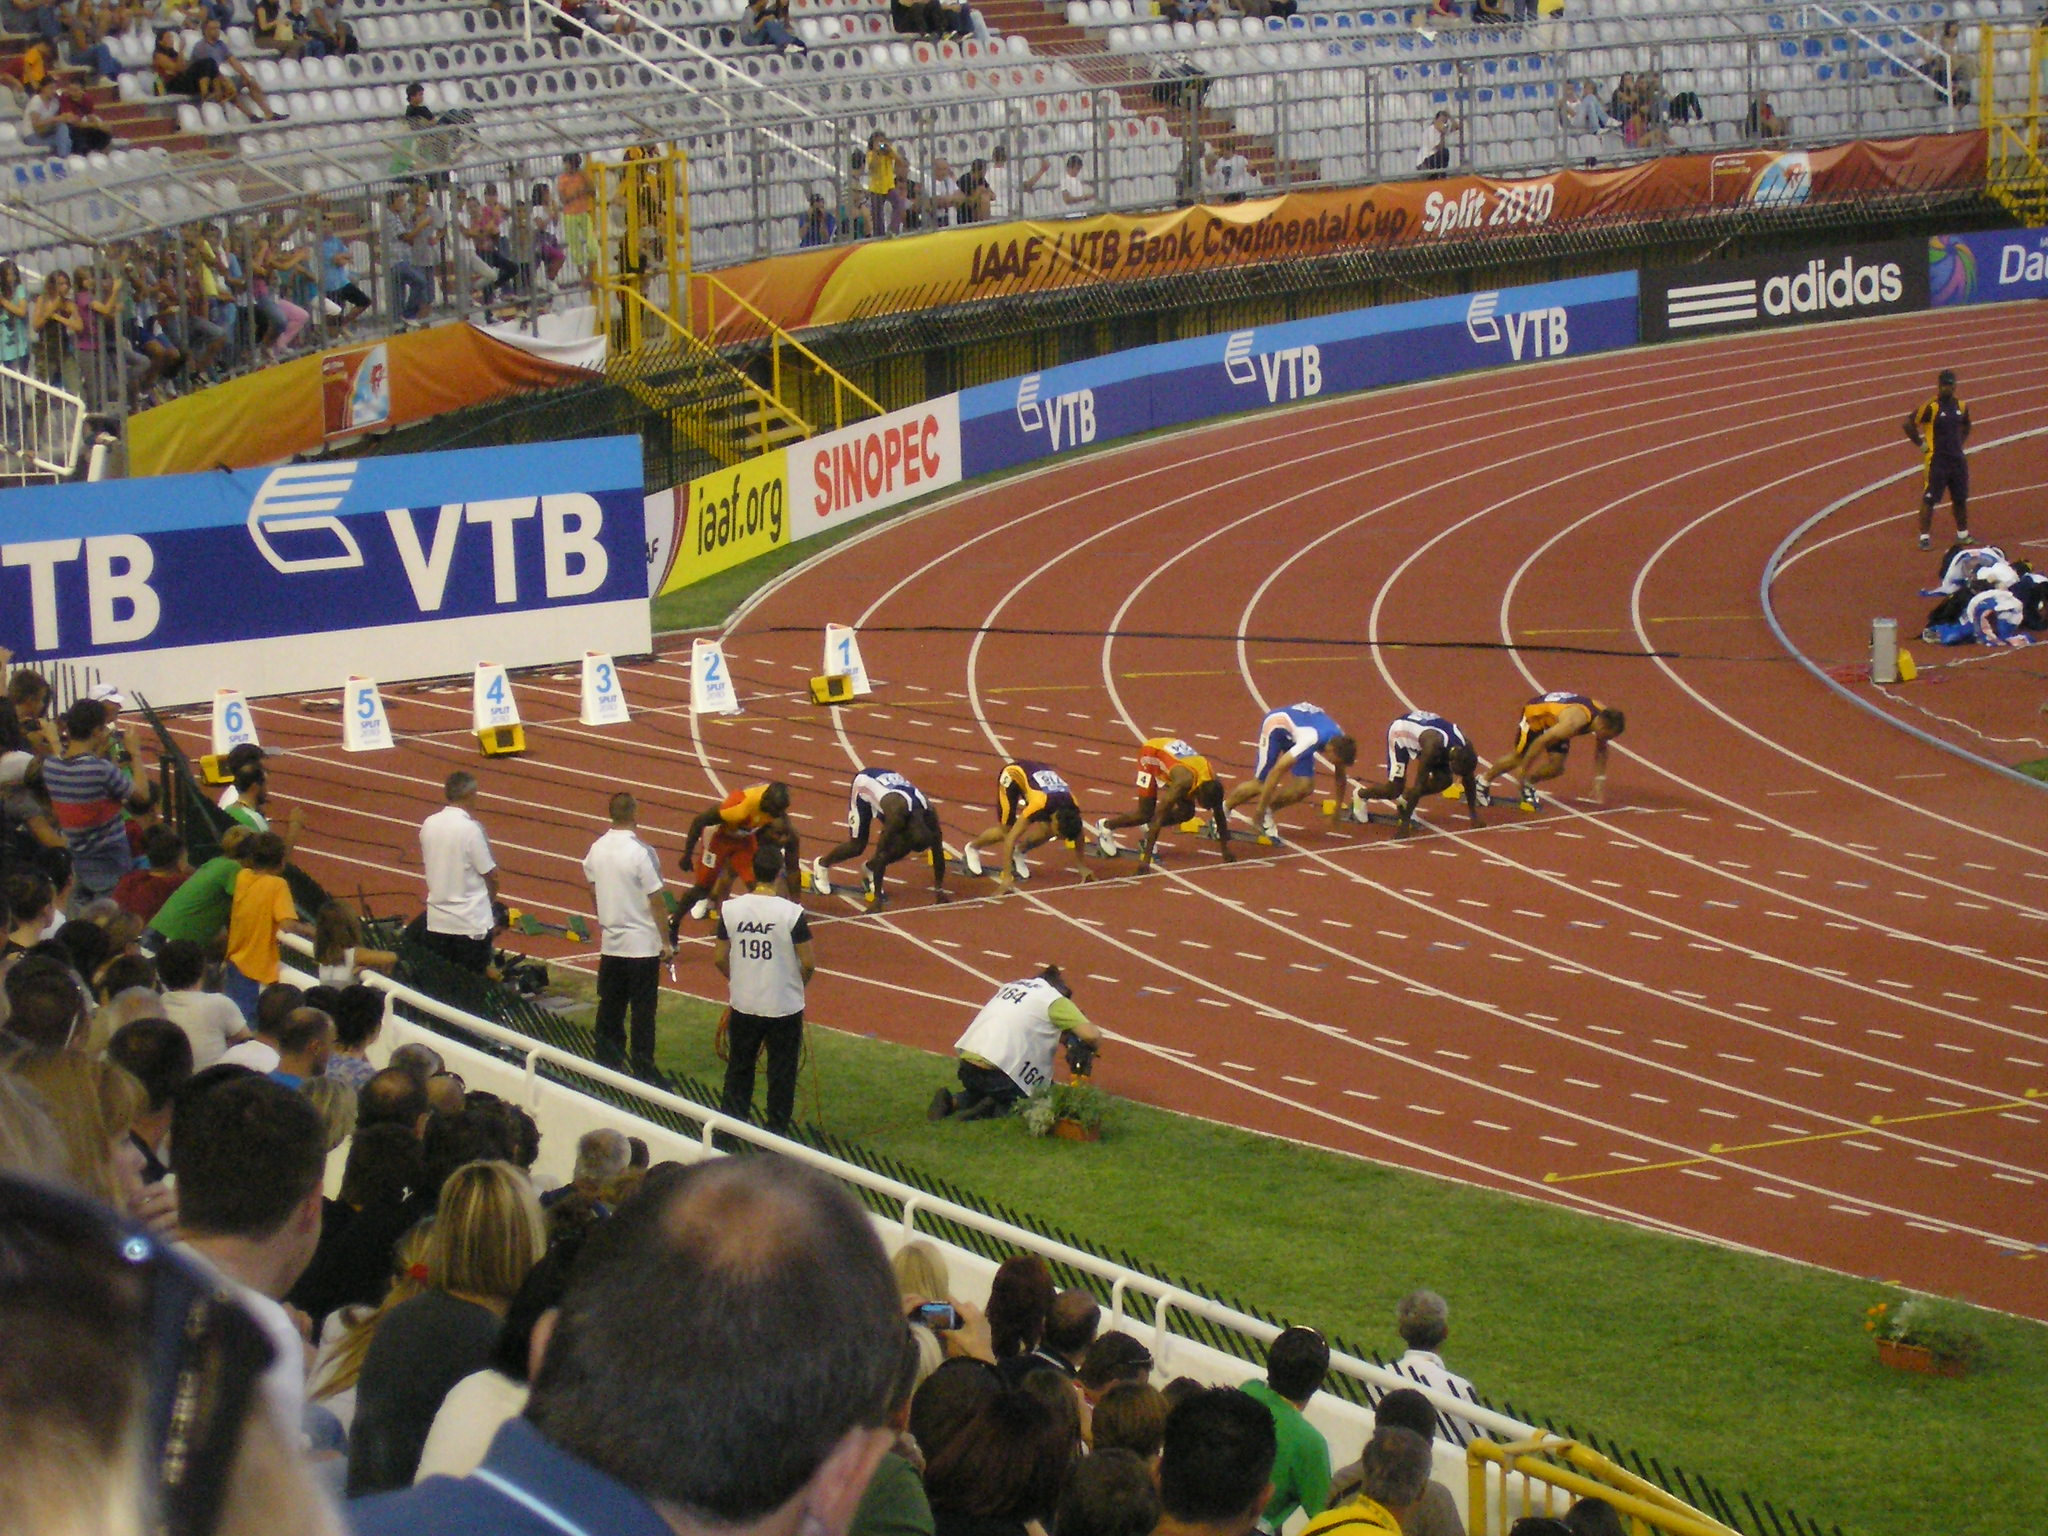
Using the sporting situation visible in the photograph, explain why anaerobic ATP production would make an important contribution at the start of the activity.
Apply the concept of the energy continuum to the activity shown.
Predict how the predominant ATP supply would differ if one of these athletes instead continued exercising for an extended period at submaximal intensity.
During that extended submaximal exercise, the athlete suddenly increases intensity. Predict the immediate change in relative energy-system contribution.
Question 10
The illustration below shows several body regions associated with the human microbiome. The drawings of microorganisms are schematic; no identification of individual microorganisms is required.
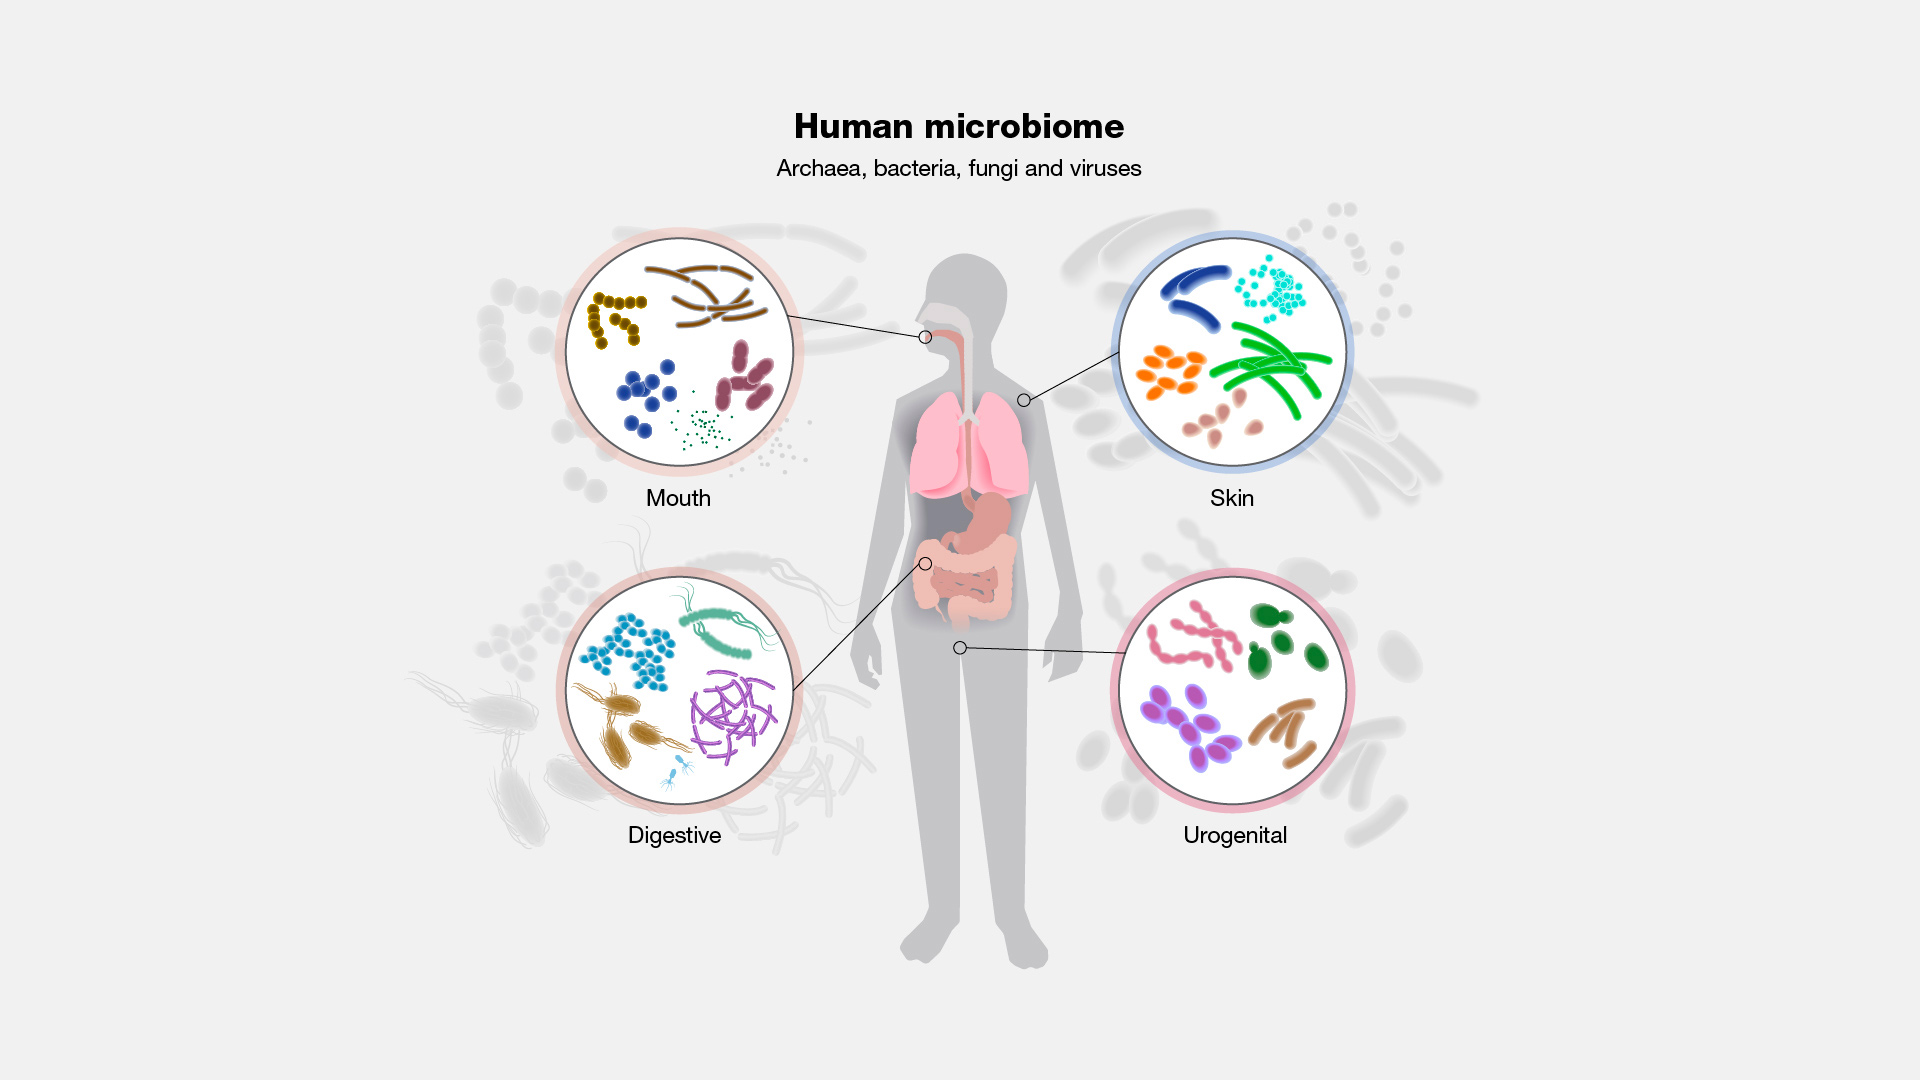
Using the illustration, identify the labelled body region directly relevant to the gut microbiome studied in A.2.2.3.
Using this region of the image as your context, explain how two factors identified in the SEHS syllabus could influence the gut microbiome and how this could, in turn, influence health or sporting performance.
An athlete changes their diet and later records both a change in their gut microbiome and improved sporting performance. Evaluate the claim that the change in diet caused the improvement in performance through the microbiome.