
Types of error
· Error = difference between a measured value and the true value.
· Random errors cause readings to be spread unpredictably above and below the true value.
· Random errors reduce precision because repeated readings are not close together.
· Random errors can be reduced by repeating measurements and calculating a mean value.
· Systematic errors shift all readings in the same direction from the true value.
· Systematic errors reduce accuracy because results are consistently too high or too low.
· Systematic errors are not reduced by taking a mean; they require calibration, correcting the method, or removing the fault.
· Common examples: parallax error, incorrect calibration, reaction-time delay, faulty apparatus, and poor experimental method.
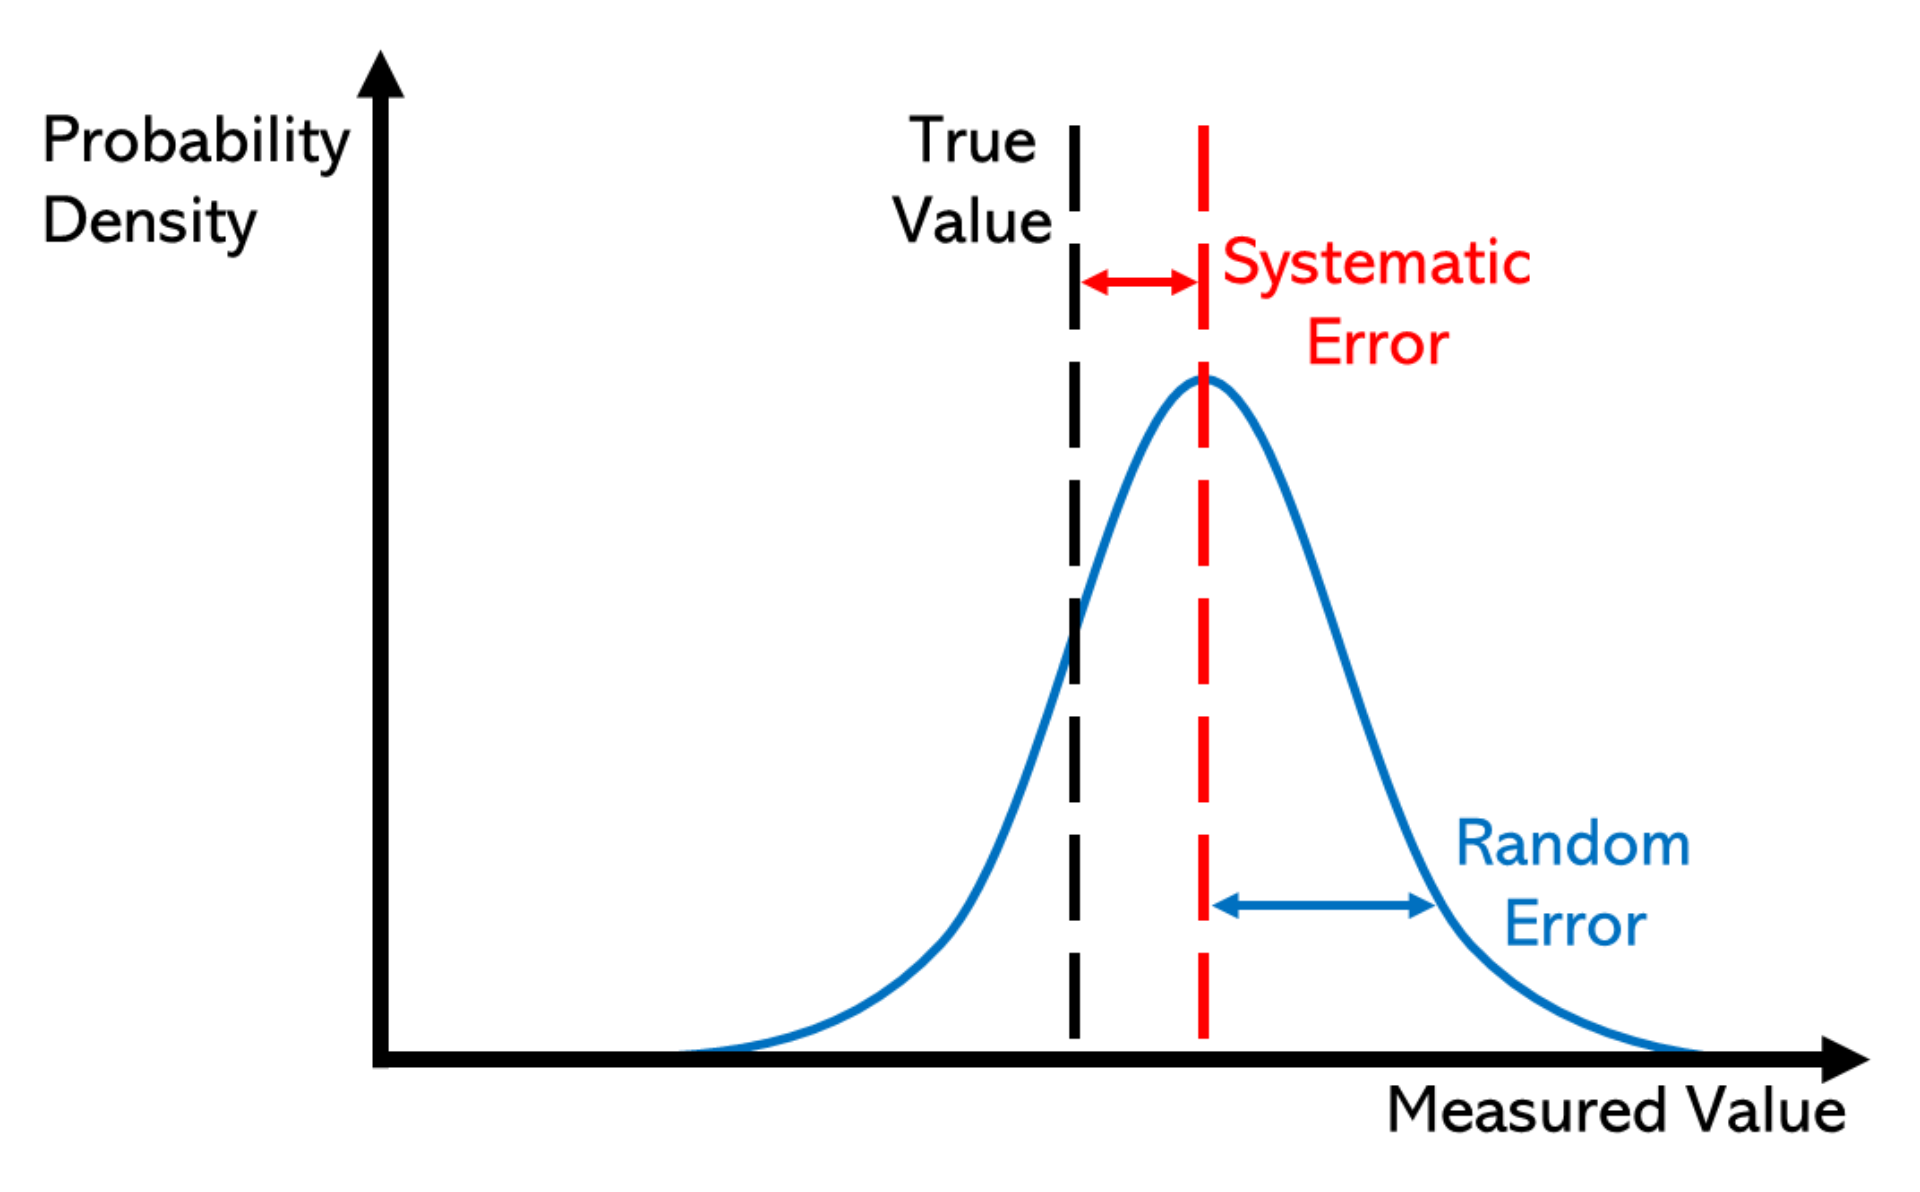
This diagram shows how random error produces spread in readings, while systematic error shifts the whole set of readings away from the true value. It is useful for comparing precision and accuracy in repeated measurements. Source
Zero errors
· Zero error = a type of systematic error where an instrument does not read zero when it should.
· Example: a micrometer reads +0.02 mm when fully closed, so all readings are too large by 0.02 mm.
· Correct readings by applying a zero correction:
· If instrument reads positive at zero, subtract the zero error from each reading.
· If instrument reads negative at zero, add the zero error to each reading.
· In exam answers, always state that a zero error affects all measurements in the same way.
Precision and accuracy
· Accuracy = how close a measurement is to the true value.
· Precision = how close repeated measurements are to each other.
· A result can be precise but inaccurate if readings are close together but affected by a systematic error.
· A result can be accurate but imprecise if readings scatter around the true value.
· Improving precision: use instruments with smaller scale divisions, repeat readings, and use consistent technique.
· Improving accuracy: remove systematic errors, calibrate instruments, avoid parallax, and use a valid method.
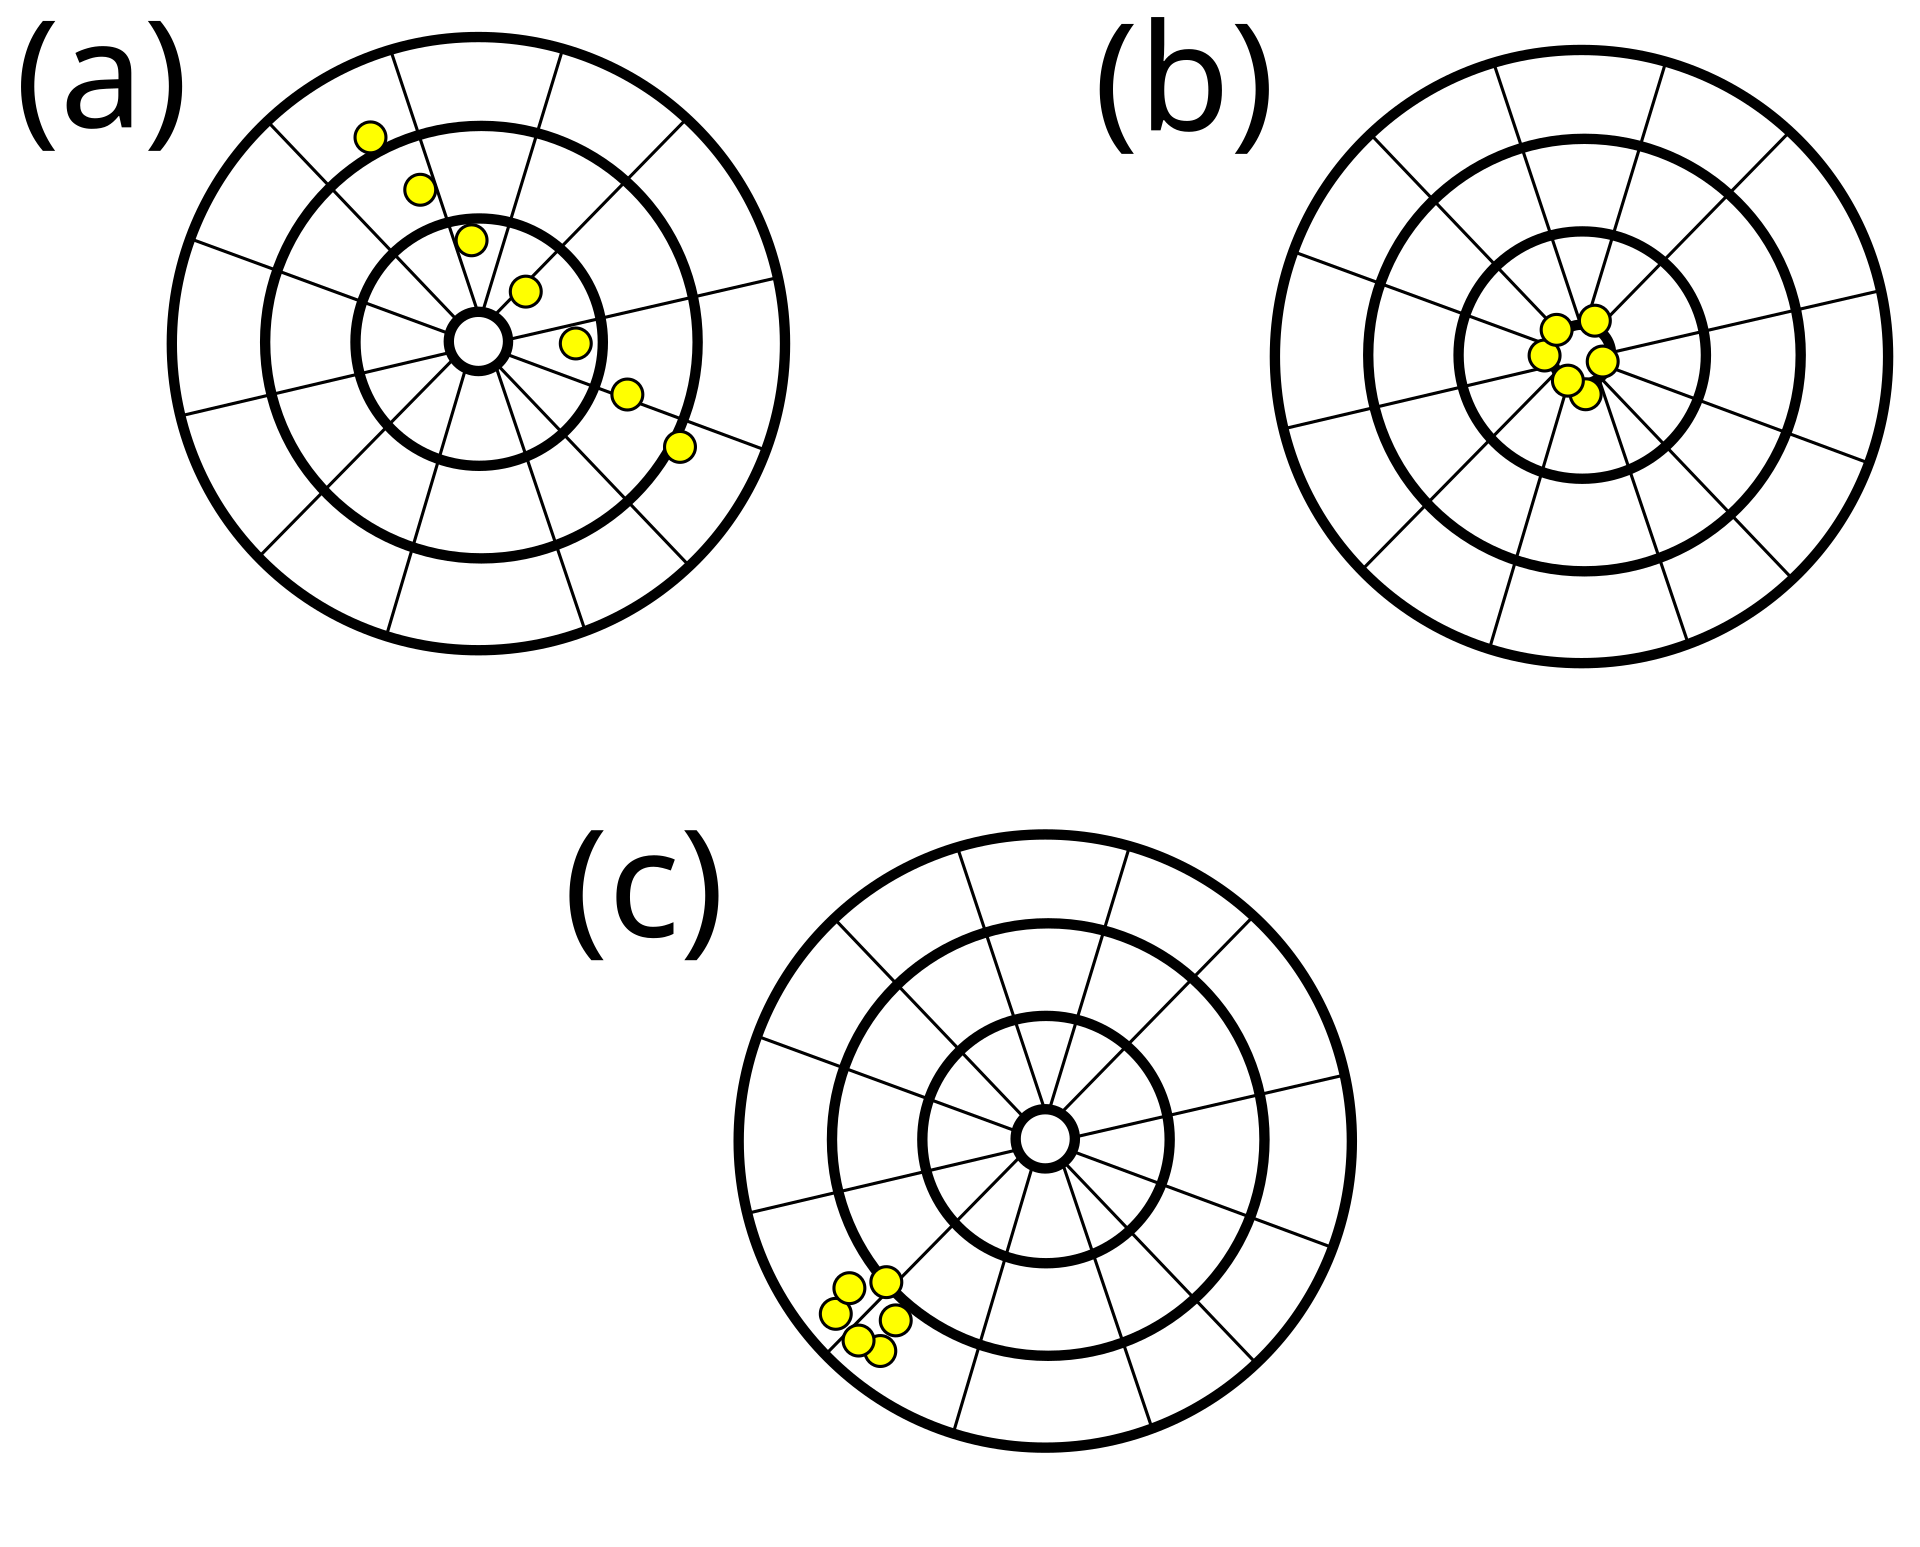
The target diagrams show the difference between accuracy and precision. A tight cluster means high precision, while closeness to the centre means high accuracy. Source
Uncertainty in single measurements
· Uncertainty gives the range within which the true value is expected to lie.
· For an analogue scale, uncertainty is often taken as ± half the smallest division.
· For a digital instrument, uncertainty is often ± the smallest displayed unit.
· Write measurements as: value ± absolute uncertainty, e.g. 12.4 ± 0.1 cm.
· Absolute uncertainty has the same unit as the measured quantity.
· Percentage uncertainty = (absolute uncertainty ÷ measured value) × 100%.
· Larger percentage uncertainty means a measurement is less reliable.
Uncertainty in repeated measurements
· Repeating measurements helps reveal random error.
· Best estimate = mean value of repeated readings.
· A simple estimate of uncertainty from repeats: half the range.
· Half range = (largest reading − smallest reading) ÷ 2.
· Quote result as: mean ± half-range uncertainty.
· Ignore obvious anomalies only if there is a clear reason, e.g. a timing mistake or misread scale.
Combining uncertainties in derived quantities
· A derived quantity is calculated from measured quantities, e.g. area, speed, density, resistance.
· For addition or subtraction, add absolute uncertainties.
· Example: if L = a + b, then ΔL = Δa + Δb.
· For multiplication or division, add percentage uncertainties.
· Example: if v = s ÷ t, then % uncertainty in v = % uncertainty in s + % uncertainty in t.
· For powers, multiply the percentage uncertainty by the power.
· Example: if A = πr², then % uncertainty in A = 2 × % uncertainty in r.
· Convert final percentage uncertainty back to absolute uncertainty if the answer requires value ± uncertainty.
Exam technique: wording that gains marks
· For random error, write: causes scatter in readings; reduced by repeats and averaging.
· For systematic error, write: all readings are shifted in the same direction; cannot be reduced by averaging.
· For zero error, write: instrument gives a non-zero reading when the true reading is zero.
· For precision, write: closeness of repeated readings to each other.
· For accuracy, write: closeness to the true value.
· Always include units with absolute uncertainty.
· Always use % uncertainty when multiplying or dividing measured quantities.
· When comparing data, the result with the smaller percentage uncertainty is usually more reliable.
Common mistakes to avoid
· Do not say random errors can be eliminated; they can only be reduced.
· Do not say systematic errors are reduced by averaging; averaging repeated biased readings keeps the bias.
· Do not confuse accurate with precise.
· Do not add percentage uncertainties for addition/subtraction calculations.
· Do not add absolute uncertainties for multiplication/division calculations.
· Do not forget the ± sign when quoting uncertainty.
· Do not give percentage uncertainty without stating what quantity it refers to.
Checklist: can you do this?
· Explain the effects of random errors and systematic errors, including zero errors.
· Distinguish clearly between precision and accuracy.
· Calculate absolute uncertainty and percentage uncertainty.
· Combine uncertainties using absolute uncertainties for addition/subtraction.
· Combine uncertainties using percentage uncertainties for multiplication/division.