
OCR Specification focus:
‘Present observations and primary data in an appropriate format while practical work is being carried out.’
Recording observations and raw data is essential for producing reliable biological investigations, supporting valid analysis, and ensuring that results are clearly communicated and traceable from their source.
The importance of recording observations and raw data
Accurate observation and data recording underpin every stage of biological investigation. Observations may be qualitative (descriptive features such as colour change, texture or behaviour) or quantitative (numerical measurements such as time, length, pH or volume). Raw data refers to primary measurements collected directly during the experiment, before any processing, calculations or statistical treatment. High-quality recording allows other scientists to repeat the investigation, verify findings and check for sources of error.
Characteristics of high-quality raw data recording
To meet OCR standards, raw data must be recorded systematically, clearly and in real time while the practical work occurs, avoiding later reconstruction from memory. Effective data recording should demonstrate:
Clarity, so information is readable and unambiguous
Completeness, with no missing entries or unexplained gaps
Accuracy, matching the precision of the measuring instrument
Traceability, allowing every value to be linked to a method and context
Organisation, enabling simple transfer to tables, graphs or further analysis
When records meet these standards, the dataset becomes dependable and suitable for valid interpretation.
Using appropriate units and measurement details
Students must record units alongside every measurement and maintain consistency throughout. This ensures values are meaningful and prevents misinterpretation. Instruments should be noted, because identical measurements taken with different apparatus may have different levels of precision. For time-based or progressive experiments, all readings should be clely linked to the conditions under which they were taken, such as temperature, reagent volume or time point.
Raw data tables
Most quantitative observations should be recorded in well-structured tables created before data collection begins.
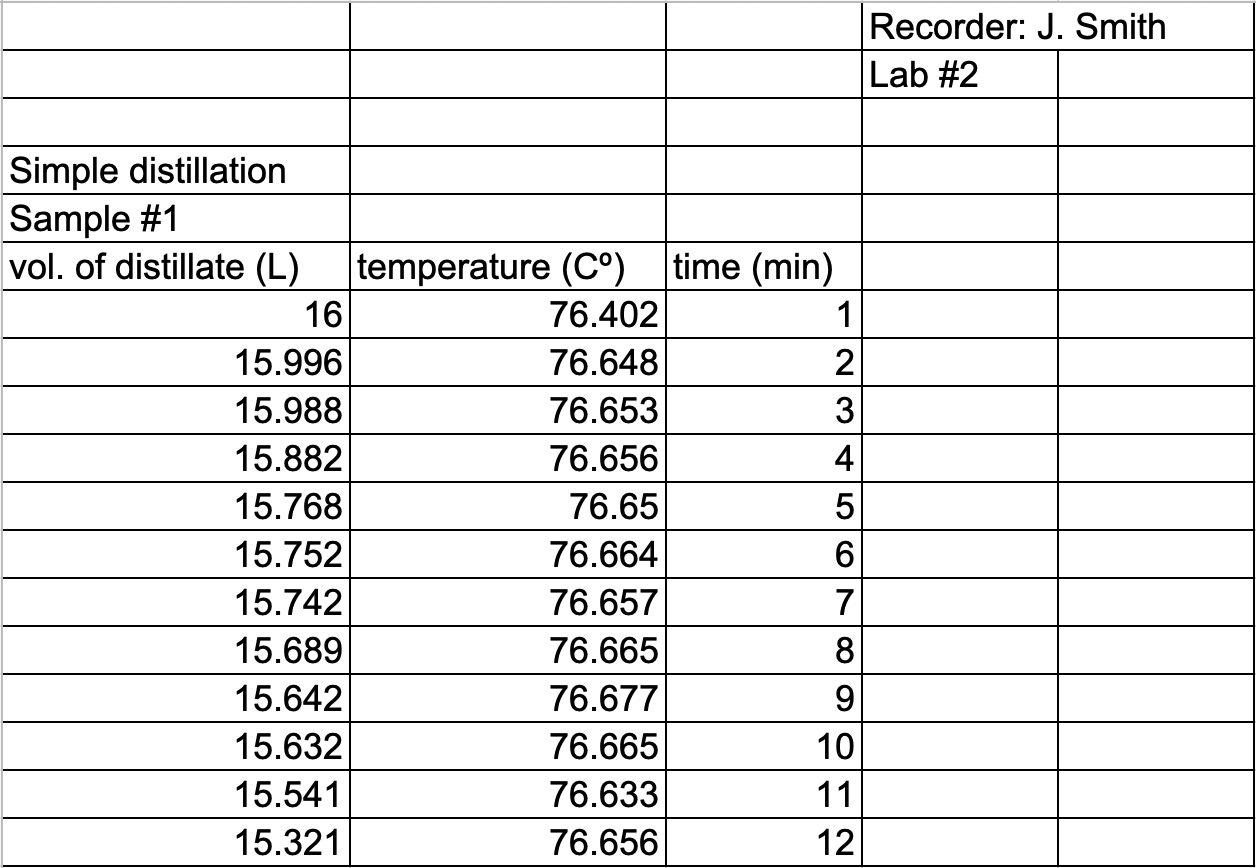
A simple raw data table showing clear headings, units, and time-series measurements, illustrating the structure needed for accurate and traceable primary data recording. Source.
Tables should include:
A descriptive title that states what is being measured
Columns with clear headings and correctly stated units
Independent variable values in the left-hand column
Dependent variable measurements recorded in adjacent columns
Replicates, entered in separate columns to allow later averaging
Designing a clear table in advance helps prevent missing data and ensures that trends, anomalies and errors become visible at an early stage.
Precision, significant figures and readability
The number of decimal places in raw data should match the precision of the instrument used, supporting meaningful later analysis.
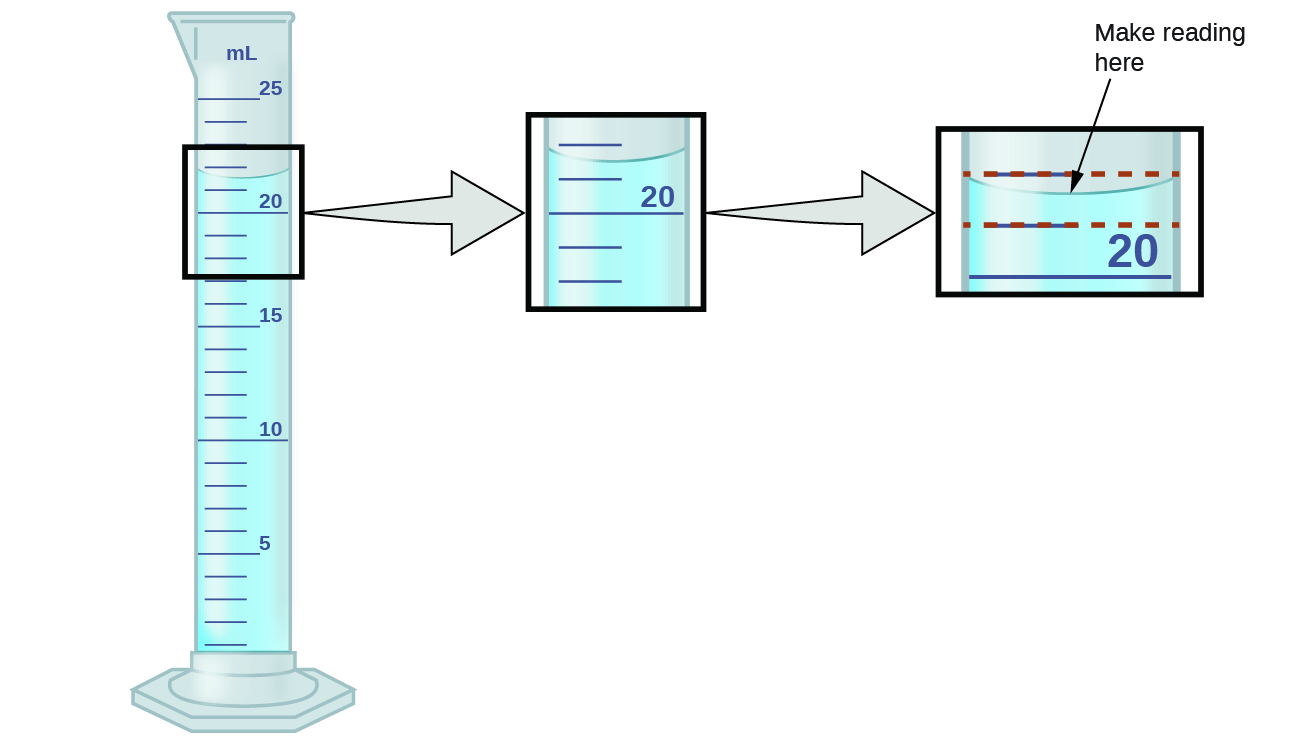
A labelled diagram showing how to read liquid volume at the bottom of the meniscus to ensure accuracy and correct precision when recording raw measurements. Source.
Final answers may later be rounded to a justified number of significant figures, but raw data must retain its original precision to support transparency.
Recording qualitative observations
Qualitative observations must be detailed, objective and relevant to the biological context. Descriptions should avoid vague language and should focus on measurable or clearly recognisable features. Useful qualitative notes may include:
Colour changes in chemical tests
Presence or absence of growth in cultures
Behavioural responses in organisms
Descriptions of precipitate formation or clarity of solutions
These details can support or explain trends in quantitative data, especially when evaluating anomalies or unexpected outcomes.
Ensuring reliability of recorded data
To record reliable raw data, students should follow consistent measurement techniques, use appropriate apparatus and repeat measurements where possible. Reliability is strengthened when:
Replicates reduce the influence of random error
Control variables are monitored and noted
Environmental conditions are recorded if relevant
Zero errors, calibration issues or faults are documented
Raw data should never be altered once written; if corrections are necessary, the original value should remain visible, with a clear note explaining the change.
Using laboratory notebooks, digital tools and data logging
Raw data may be recorded in laboratory notebooks or electronically, but in every case must be secure, chronological and backed up where relevant. Increasingly, automated data loggers and sensors are used to capture readings at high frequency or over long durations.
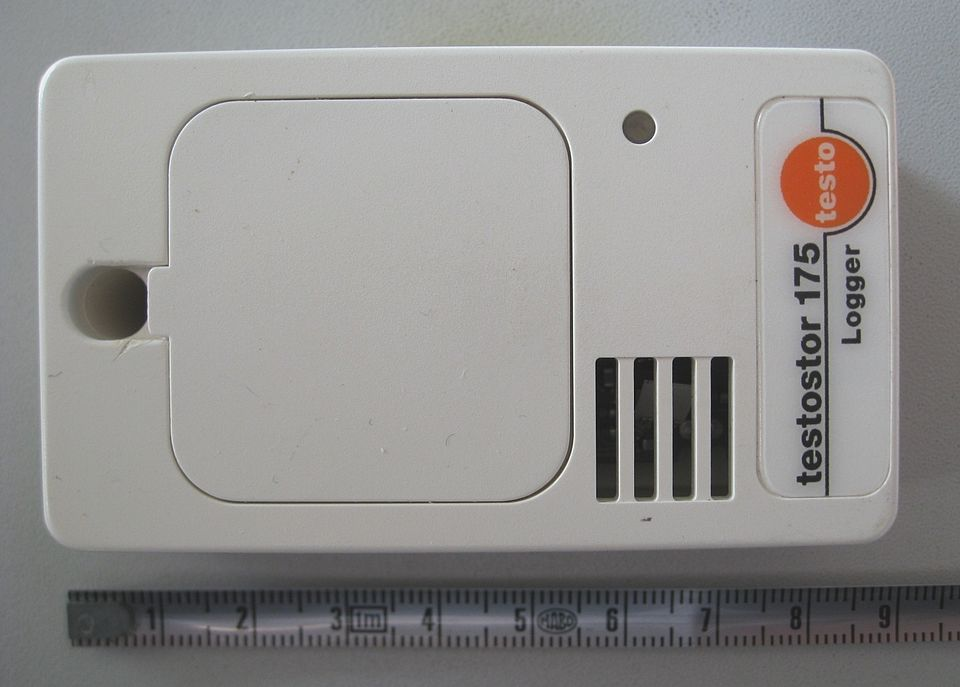
A portable temperature and humidity data logger used to collect primary measurements automatically, illustrating how sensors support accurate and continuous raw data recording. Source.
These systems can enhance precision but still require the student to label units, conditions and sensor types to ensure contextual understanding.
Distinguishing raw data from processed data
Raw data must be kept separate from processed data, such as calculated means, percentage changes or rates. Recording them separately maintains clarity about which values were directly measured and which were derived later. This distinction is vital for effective evaluation, especially when identifying anomalies or assessing methodological limitations.
The role of clear presentation in later analysis
Well-recorded raw data forms the foundation of valid scientific conclusions. Clear tables, accurate units and precise entries enable smooth progression to graph plotting, statistical testing and trend interpretation. Since OCR written exams assess practical skills, maintaining rigorous standards in raw data recording ensures that students can justify their conclusions and demonstrate full command of experimental evidence.
Practice Questions
Question 1 (2 marks)
During an investigation, a student records the time taken for a colour change in a reaction. State two features that must be included when recording raw data in a table during the experiment.
Question 1 (2 marks)
Award one mark for each correct point:
Units included in the column headings
Clear headings identifying variables (independent and dependent)
(Max 2 marks)
Question 2 (5 marks)
A student investigates the effect of temperature on enzyme activity. The temperature is recorded using a digital thermometer, and the time taken for a substrate to be broken down is measured with a stopwatch. The student repeats each measurement three times.
Describe how the student should record their raw data during the investigation to ensure that it is clear, reliable and useful for later analysis.
Question 2 (5 marks)
Award up to five marks from the following points:
Use of a clearly structured table with headings for independent and dependent variables (1 mark)
Units shown in the column headings, not in the data cells (1 mark)
Inclusion of repeat measurements in separate columns or clearly labelled rows (1 mark)
Data recorded to an appropriate degree of precision based on the measuring instruments (1 mark)
All raw measurements written during the practical and not altered later, maintaining original values (1 mark)
FAQ
Do not insert made-up values. Leave the cell blank, add a brief note beside the table, and continue recording subsequent measurements as normal.
If appropriate, document the reason for the missing value in your notebook. Later processing, such as calculating means, should exclude the missing data rather than altering the raw dataset.
Focus on measurable or clearly recognisable features and avoid vague language.
Useful strategies include:
Using a fixed checklist (e.g., colour categories, presence/absence, growth stages)
Describing intensity or extent with predefined terms (such as pale, moderate, strong)
Recording observations at consistent time points
Yes, if a condition could influence the results. Factors such as room temperature, light level or humidity can explain anomalies or variation.
A brief note alongside the table is usually sufficient, especially in biological investigations where living organisms are involved.
Use the same observer throughout where possible, or provide clear criteria if multiple observers are involved.
Blinding any identifying labels can help prevent unconscious expectations affecting what is recorded, particularly in behavioural or growth-based studies.
Raw data provides an evidence trail that allows others to verify results. If values are erased, it becomes unclear whether a mistake or intentional alteration occurred.
If a correction is needed, cross out the original value with a single line, record the new value beside it, and add an explanatory note.
