
OCR Specification focus:
‘Present processed data in suitable formats, such as well-structured tables or graphs appropriate to the data collected.’
Presenting processed data clearly helps communicate patterns, trends and relationships effectively, allowing accurate interpretation and supporting valid biological conclusions in line with OCR expectations for analysis skills.
Importance of Clear Data Presentation
Processed data are measurements or observations that have been manipulated, calculated or organised after collection, such as means, rates or percentage changes. Clear presentation ensures that patterns and differences are easy to observe, helps avoid misinterpretation, and supports the reliability of subsequent analysis. Well-structured presentation must match the type of data, the purpose of the investigation and the relationships being explored. Students are expected to choose formats that best reveal trends and allow readers to interpret data efficiently.
Selecting a Suitable Format
Choosing the right format depends on the variables and the nature of the processed data. OCR emphasises that the chosen presentation must be appropriate to the investigation’s objectives. Common formats include:
Tables for displaying processed values clearly and systematically
Line graphs for continuous data showing how one variable changes in relation to another
Bar charts for categorical or discontinuous data, highlighting differences between groups
Scatter graphs for investigating correlations or relationships between two continuous variables
The selected format should highlight biological meaning, prioritising clarity over decoration or unnecessary visual elements.
Constructing Tables for Processed Data
Tables must be organised to allow information to be read easily. They should always include:
A descriptive title stating what is being presented
Clear column and row headings
Units in headings and not repeated in each cell
Consistent decimal places or significant figures across processed values
A logical layout, usually with the independent variable placed in the left column, followed by processed dependent data
Tables should not contain raw data when the aim is to communicate processed values. Instead, they should summarise the calculations to help reveal trends, such as changes in rate, mean values or percentage differences.
Presenting Graphs Clearly
Graphs are visual tools for revealing relationships and trends in processed data. When drawing graphs, processed values must be plotted accurately and displayed in a format that reflects the biological relationship under investigation.
Key Graphing Principles
Graphs must include:
A clear title summarising the relationship shown
Independent variable on the x-axis and dependent variable on the y-axis
Quantities and units on both axes
Linear or logarithmic scales selected to spread points effectively
Evenly spaced scales that do not distort trends
Correctly plotted data points with sharp, visible marks
A line of best fit to represent the trend when suitable
Types of Graph for Processed Data
A line graph is appropriate when data are continuous and a trend over a range is expected
A scatter graph is suitable when looking for a correlation, allowing calculation of trend lines or gradients later in analysis.
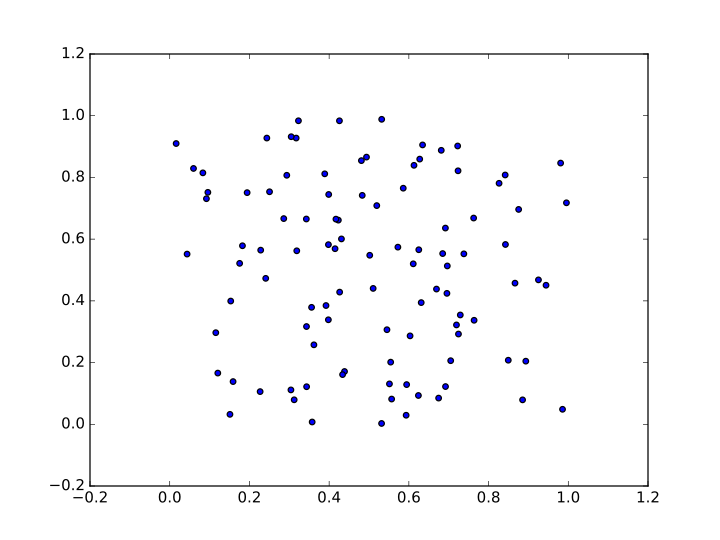
A simple scatter graph showing individual data points with clear x- and y-axes. This format highlights relationships between two continuous variables and prepares data for adding a line of best fit. Source.
A bar chart clearly compares categories, making it useful for processed means of grouped or discontinuous data.
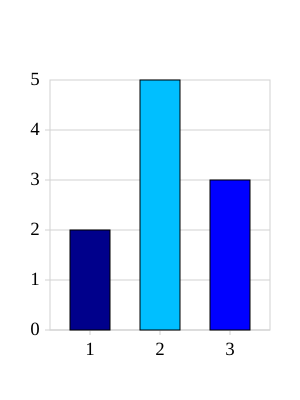
A clear bar chart illustrating how categorical or discontinuous data can be compared visually. This format makes differences between groups easy to interpret at a glance. Source.
Using Units, Labels and Titles
All processed data must be fully labelled. Omitting units or using ambiguous headings reduces clarity and can prevent valid interpretation. Axes, headings and legends should use standard scientific units and recognisable biological terminology. The title must communicate the biological context, not just repeat axis labels.
Definition of Key Presentation Terms
Line of best fit: A straight or curved line that best represents the general trend of data points on a graph.
Once a line of best fit is drawn, it becomes easier to visualise direction, strength or proportionality of a relationship. Clear presentation supports later tasks such as interpreting gradients or identifying anomalies.
Enhancing Clarity and Accuracy
To ensure the processed data are presented to OCR standards, students should:
Maintain consistent significant figures
Avoid clutter, unnecessary colours or distracting grid lines
Use legends only when multiple data sets are plotted
Ensure no extrapolation unless justified
Label anomalous points if they are highlighted for evaluation purposes
A short explanatory caption beneath graphs can further support clarity by reminding the reader of what the data demonstrate.
Supporting Interpretation Through Good Presentation Practice
A well-presented table or graph allows meaningful biological interpretation, making it easier to identify trends such as positive correlations, enzyme activity changes, or effects of environmental factors. Clear presentation strengthens the connection between data and conclusion, fulfilling the OCR requirement to present processed data in a suitable format that genuinely aids understanding.
Practice Questions
Question 1 (2 marks)
A student has collected processed data from an investigation into the effect of light intensity on the rate of photosynthesis. State two features that must be included when presenting these processed data on a graph.
Question 1 (2 marks total)
Award one mark for each relevant feature, up to two marks:
• Both axes labelled with quantity and unit (1)
• Independent variable on the x-axis and dependent variable on the y-axis (1)
• Use of a clear title (1)
• Even, appropriate scale on each axis (1)
• Data points plotted accurately (1)
Question 2 (5 marks)
A group of students investigated the effect of temperature on enzyme activity and produced a table of processed mean reaction rates at different temperatures. They now wish to present their data clearly to help identify trends. Describe how the students should construct and present their graph so that the data are displayed clearly and can be interpreted accurately.
Question 2 (5 marks total)
Award one mark for each of the following points, up to five marks:
• Select a line graph because temperature and reaction rate are continuous variables (1)
• Label axes clearly with quantities and units, with temperature on the x-axis and rate on the y-axis (1)
• Choose scales that are even and make good use of the graph space, without distorting trends (1)
• Plot data points accurately and include a line of best fit to show the overall trend (1)
• Ensure clarity by avoiding clutter, using a title, and including a legend only if more than one dataset is shown (1)
FAQ
Connect data points only when measurements are taken in a continuous sequence, such as over time, where changes between points are meaningful.
A line of best fit is used when showing the general trend is more important than the precise change between each pair of points. It smooths biological variation and helps interpretation, especially when identifying correlations or estimating gradients.
Use scaling techniques to keep the graph readable. This may include:
• Using standard form in table headings
• Choosing logarithmic scales when differences span several magnitudes
• Adjusting axis intervals to avoid compressing points
The goal is clarity, not squeezing the full range onto an unsuitable scale.
Not always. If including zero would waste space and obscure trends, you may start from a non-zero value.
However, you must avoid misleading the reader. A broken axis or clear labelling prevents misinterpretation. For bar charts, zero should normally be included so bar lengths accurately represent their values visually.
Use error bars when you want to show data spread or reliability, such as standard deviation or range of repeated results.
They visually communicate the level of confidence in processed means and make patterns more meaningful during analysis.
A good caption briefly explains what the viewer is looking at and highlights the biological context.
Effective captions typically state:
• The variables involved
• The subject or system being studied
• Any important conditions
Captions help the graph stand alone as an informative scientific figure.
