
OCR Specification focus:
‘Design and carry out practicals on plant hormones’ effects on growth; use serial dilutions and appropriate measurements.’
Plant hormones, or plant growth regulators, control development and responses to environmental stimuli. Investigating their effects involves designing experiments, creating serial dilutions, and measuring quantifiable growth outcomes.
Understanding Plant Hormones
The Role of Hormones in Plants
Plant hormones such as auxins, gibberellins, cytokinins, abscisic acid, and ethylene coordinate growth, development, and responses to environmental changes. Investigations into these hormones help to demonstrate their mode of action, effect concentration, and site of influence.
Auxins promote cell elongation, particularly in shoots.
Gibberellins stimulate stem elongation and seed germination.
Cytokinins promote cell division and delay senescence.
Abscisic acid (ABA) induces dormancy and stomatal closure under stress.
Ethylene regulates fruit ripening and leaf abscission.
These hormones often interact, so the observed growth pattern depends on the balance between hormones rather than a single chemical signal.
Designing Practical Investigations
Key Principles of Experimental Design
When investigating plant hormones, experiments must be controlled, repeatable, and quantitative. A reliable design includes:
A clear hypothesis predicting hormone effects on growth.
Independent variable: hormone concentration or type.
Dependent variable: measurable growth change (e.g. shoot length, curvature, or germination rate).
Control variables: temperature, light intensity, humidity, pH, and species consistency.
A control group with no hormone treatment to ensure observed effects are due to the hormone alone.
Control Group: A set of subjects or samples not exposed to the independent variable, used as a baseline for comparison in experiments.
Serial Dilutions
Creating a Range of Hormone Concentrations
Because plant hormones act at very low concentrations, students must prepare serial dilutions to investigate their effect gradient.
Method outline:
Start with a stock solution of known hormone concentration.
Transfer a fixed volume (e.g. 1 cm³) into another container and dilute with solvent (usually distilled water).
Continue this stepwise to produce a range such as 10⁻¹, 10⁻², 10⁻³, and so on.
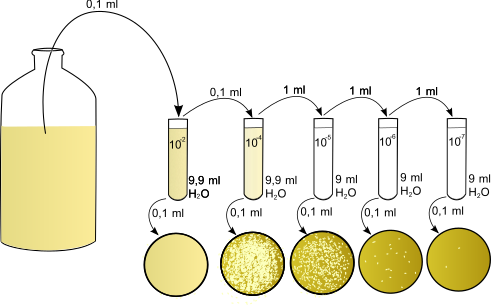
A serial dilution reduces concentration in equal steps to create a usable range for dose–response testing. The schematic illustrates fixed-volume transfer and dilution across tubes. Extra detail: icons for bacterial plating appear, but the dilution workflow is identical for hormone assays. Source.
Each dilution should then be applied to identical test organisms or tissues to determine dose-response relationships.
Serial Dilution: A stepwise dilution of a substance to obtain a range of decreasing concentrations for experimental testing.
Consistency during dilution is vital for valid results. Hormones must be well mixed, and pipettes or syringes must be rinsed between transfers to prevent contamination.
Measuring Growth and Response
Choosing a Measurable Variable
The dependent variable chosen must accurately reflect hormonal influence. Common options include:
Shoot elongation: Measure increase in stem length using a ruler or digital calliper.
Root elongation: Particularly sensitive to auxins at high concentrations.
Phototropic curvature: Measure angle of bending towards light after exposure to auxin gradients.
Seed germination rate: Used in gibberellin experiments to assess dormancy breaking.
Data Collection
Measurements should be taken at fixed time intervals and repeated for at least five samples per condition. Mean values improve reliability. Results are often plotted as growth vs. hormone concentration, producing dose–response curves.
Dose–Response Curve: A graph showing the magnitude of a biological response as a function of substance concentration.
Investigating Auxin Effects
Classic Experiment: Auxin and Phototropism
Auxin (indole-3-acetic acid, IAA) is central to phototropism, the bending of shoots towards light. Investigations typically involve coleoptiles (young shoots) from grasses such as oats (Avena).
Procedure example:
Grow seedlings in darkness to obtain straight coleoptiles.
Apply agar blocks containing different auxin concentrations to cut shoot tips.
Expose seedlings to unilateral light.
Measure the angle of curvature after a fixed period.
Expected outcome:
Low to moderate auxin levels promote elongation on the shaded side, causing bending towards light. High concentrations may inhibit elongation due to hormone saturation.
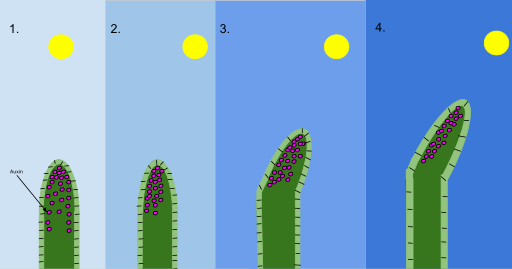
Phototropism arises when auxin redistributes to the shaded side of a shoot, stimulating cell elongation there and producing curvature towards the light source. The diagram summarises auxin movement and resulting differential growth in a young shoot, supporting investigations using unilateral light and coleoptile assays. Source.
Phototropism: Directional growth of a plant organ in response to light, typically towards a light source in shoots.
Investigating Gibberellins
Germination Experiments
Gibberellins break seed dormancy and stimulate enzyme production (e.g. amylase) in germinating seeds.
Method outline:
Soak seeds in varying gibberellin concentrations.
Incubate under controlled temperature and humidity.
Measure germination percentage or mean time to germinate.
Control seeds without gibberellin help confirm that the hormone specifically triggers germination rather than environmental factors.
Observation: Increasing gibberellin concentration enhances germination rate up to an optimum point, after which the response plateaus.
Ensuring Reliability and Accuracy
Key Considerations
To achieve valid and reproducible results, ensure:
Replication: Sufficient sample size for statistical analysis.
Randomisation: Minimise bias in sample selection and positioning.
Accurate measurement tools: Digital callipers or image analysis software for growth quantification.
Environmental control: Use of growth chambers or controlled light sources.
Reliability: The degree to which an experiment yields consistent results when repeated under identical conditions.
Analysing and Presenting Data
Statistical Treatment
Data should be summarised using mean, range, and standard deviation. To confirm significant differences between treatments, tests such as the t-test or Spearman’s rank correlation may be used depending on data type.
Graphs should include:
Clearly labelled axes with units.
Error bars to represent variability.
Titles describing hormone type and dependent variable measured.
This approach allows clear visualisation of how hormone concentration correlates with plant response and supports valid scientific conclusions.
Final Notes on Safety and Ethics
Plant hormone investigations must comply with laboratory safety and ethical standards. Gloves should be worn when handling concentrated hormones, and all biological materials should be disposed of responsibly. Students should also ensure the minimisation of waste and avoid unnecessary harm to living specimens.
Practice Questions
Question 1 (2 marks)
Explain why serial dilutions are used when investigating the effects of plant hormones such as auxin or gibberellin.
Mark scheme:
1 mark for stating that serial dilutions allow the creation of a range of known concentrations of the hormone.
1 mark for explaining that this enables researchers to determine the concentration that produces the greatest or most measurable response (e.g. optimum growth or curvature).
Question 2 (5 marks)
Describe how you would design and carry out an experiment to investigate the effect of auxin concentration on shoot growth in seedlings. Include key variables and how you would ensure reliability.
Mark scheme:
1 mark for identifying the independent variable: auxin concentration (prepared using serial dilutions).
1 mark for identifying the dependent variable: measurable change such as shoot length or angle of curvature.
1 mark for mentioning control variables: same plant species, age, light intensity, temperature, and volume of solution applied.
1 mark for describing the use of a control group with no auxin treatment.
1 mark for explaining how to improve reliability: use several replicates and calculate mean results, or use statistical analysis to confirm significance.
FAQ
Small pipetting or mixing errors can cause large differences in actual hormone concentration, especially at very low levels. This can distort the apparent dose–response relationship and lead to inaccurate conclusions about hormone sensitivity.
To minimise errors:
Use calibrated micropipettes and change tips between dilutions.
Mix each solution thoroughly before transferring.
Label all concentrations clearly and prepare fresh dilutions when possible.
Even slight inconsistencies can lead to misleading trends in growth data.
A control treatment allows comparison to natural growth without hormonal influence. It confirms that any change observed is due to the applied hormone, not environmental or handling factors.
Without a control:
Natural variation in plant growth could be mistaken for a hormone effect.
Data cannot be used to determine whether the hormone increased or inhibited growth relative to normal conditions.
The control provides the essential baseline for interpreting experimental results.
Researchers may measure:
Biomass: drying and weighing shoots or roots to show total growth.
Leaf area: using grid or image analysis for surface expansion.
Curvature angle: recorded photographically for tropism studies.
Cell elongation: examined microscopically in epidermal cells.
Selecting the correct measurement depends on the hypothesis—biomass for overall growth, curvature for directional response, or cell elongation for tissue-level effects.
Seedlings grow rapidly and respond strongly to small hormonal changes, allowing measurable results within days. They are also small, easy to handle, and genetically uniform when grown from a single seed batch.
Using mature plants would introduce more variability due to environmental history, uneven hormone distribution, and slower growth rates. Seedlings provide consistent, rapid responses ideal for classroom and laboratory experiments.
Although plant hormones are used in low concentrations, safety remains essential:
Wear gloves and eye protection when handling concentrated stock solutions.
Avoid inhaling powders or vapours and work in a well-ventilated area.
Clean spills immediately and dispose of solutions as instructed by safety guidelines.
Wash hands thoroughly after completing the experiment.
Good laboratory practice ensures that experiments remain both safe and reproducible.
