
OCR Specification focus:
‘Use significant figures appropriately, matching the precision of the data and ensuring numerical consistency in calculations and reporting.’
Understanding significant figures and maintaining numerical consistency are essential for ensuring experimental data and calculations reflect the true precision of measurements and support reliable, accurate scientific conclusions.
Understanding Significant Figures
Significant figures represent the digits in a measurement that are known with certainty plus one estimated digit. They convey the precision of a measurement and help ensure that reported data does not imply greater accuracy than the measuring instrument allows.
Significant Figures: The digits in a measured value that indicate its precision, including all certain digits and the first uncertain (estimated) digit.
When performing calculations, significant figures must be handled correctly to maintain consistency and prevent errors caused by overstating or understating precision.
Why Significant Figures Matter
The proper use of significant figures ensures numerical consistency — results are expressed in a way that matches the accuracy of the input data and the measuring apparatus. Using too many digits can give a false impression of certainty, while using too few can reduce the usefulness of data.
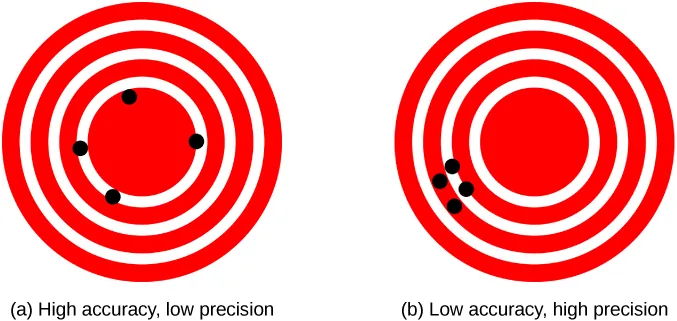
Target diagrams contrast high accuracy/low precision with low accuracy/high precision. These ideas explain why we limit reported digits: the precision of data and the accuracy of measurement determine how many significant figures are justified. Note: the figure introduces accuracy/precision explicitly, which is supportive background to sig-fig usage. Source
Scientific communication relies on accurate representation of precision. For example, stating a measurement as 1.20 m instead of 1.2 m implies that the measurement is known to the nearest centimetre rather than the nearest decimetre.
Rules for Counting Significant Figures
The number of significant figures in a value depends on the type of digits present.
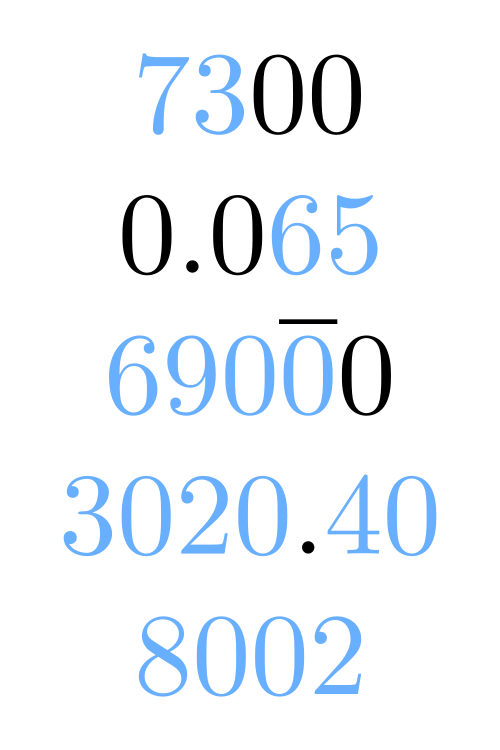
Digits highlighted in colour indicate the significant figures; uncoloured digits are not significant. The examples illustrate when zeros count (e.g., trapped zeros) and when they do not (e.g., leading zeros). This visual aligns with the standard rules used in A-Level practical data reporting. Source
The following rules govern how significant figures are counted:
All non-zero digits are significant. Example: 237 has three significant figures.
Zeros between non-zero digits are significant. Example: 2.07 has three significant figures.
Leading zeros (before the first non-zero digit) are not significant. Example: 0.0043 has two significant figures.
Trailing zeros in a number with a decimal point are significant. Example: 3.200 has four significant figures.
Trailing zeros in a whole number without a decimal point may or may not be significant — scientific notation clarifies this ambiguity.
Using Significant Figures in Calculations
Maintaining correct significant figures during calculations is crucial to ensure the propagation of precision aligns with measurement accuracy.
Multiplication and Division
When multiplying or dividing values:
The result should have the same number of significant figures as the value with the fewest significant figures in the calculation.
Addition and Subtraction
When adding or subtracting values:
The result should have the same number of decimal places as the value with the fewest decimal places.
These rules prevent misleading results where the final answer appears more precise than the least accurate measurement allows.
Rounding to Significant Figures
Rounding ensures results reflect the correct degree of precision:
If the digit after the last significant figure is 5 or greater, round up.
If it is less than 5, round down.
Always round only at the final step of a multi-step calculation to avoid rounding errors.
Intermediate rounding can accumulate error, leading to results that deviate from the correct value. Numerical consistency depends on postponing rounding until the final stage.
Numerical Consistency
Numerical consistency refers to maintaining coherent precision throughout all stages of measurement, analysis, and reporting. Every number presented — whether a measurement, calculated value, or constant — should match the level of precision justified by the data.
Inconsistent significant figures can undermine confidence in results and indicate poor experimental practice. For example, combining 3.2 (two significant figures) with 3.245 (four significant figures) must yield a result rounded appropriately to maintain consistency.
Numerical Consistency: The practice of ensuring that all numerical results are expressed with a level of precision consistent with the uncertainties and significant figures of the input data.
Maintaining numerical consistency requires that the reported precision matches the actual limits of measurement accuracy. This principle applies equally to raw data, processed results, and final conclusions.
Role of Uncertainty in Significant Figures
Every measurement carries an uncertainty, which dictates the number of meaningful digits that can be justified.
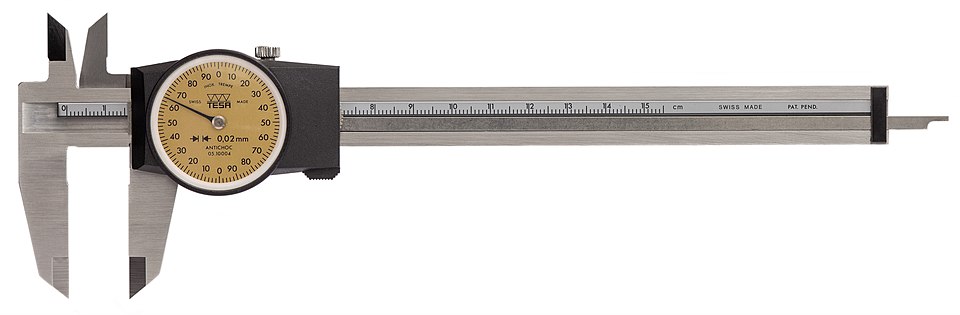
A dial vernier caliper measuring length to fine increments demonstrates how instrument resolution sets the maximum significant figures in a result. The last recorded digit is the first uncertain one, and should be reported consistently with the tool’s precision. This directly underpins uncertainty statements such as ±(half a scale division). Source
EQUATION
—-----------------------------------------------------------------
Percentage Uncertainty (%) = (Absolute Uncertainty / Measured Value) × 100
Absolute Uncertainty = Estimate of possible error in a measurement, in the same units as the value measured
Measured Value = The recorded numerical result of a measurement
—-----------------------------------------------------------------
The uncertainty value determines how many significant figures should be reported. A measurement with a high relative uncertainty should be quoted with fewer significant figures than one with low relative uncertainty.
Consistency in Reporting Calculations
When reporting calculations:
All raw measurements should be recorded with their appropriate number of significant figures.
Calculated quantities should retain consistent precision based on the input data.
Constants used (e.g., g = 9.81 m s⁻²) should have appropriate precision relevant to the context of the calculation.
Final results should display the correct number of significant figures, and any units must be clearly stated.
Maintaining this discipline supports reproducibility and ensures others can interpret and verify results confidently.
Common Errors and Good Practice
To achieve high-quality, reliable data representation, students should avoid these frequent mistakes:
Reporting too many digits after performing calculations.
Mixing decimal places and significant figures inconsistently.
Ignoring the influence of uncertainty on precision.
Rounding at multiple intermediate stages.
Presenting inconsistent figures across data tables and graphs.
Good practice includes:
Writing all measurements to the same decimal place where appropriate.
Recording uncertainties clearly.
Ensuring that any calculated means, gradients, or derived quantities respect the least precise data input.
Checking that all figures in a report align with the expected experimental precision.
Applying Significant Figures in Graphs and Tables
When presenting data graphically or in tables:
Include units in column headings.
Keep numerical values consistent in precision across rows and columns.
Express calculated gradients or intercepts using an appropriate number of significant figures, matching the accuracy of plotted data.
Avoid mixing overly precise and imprecise values within a single dataset.
By doing so, students reinforce both numerical consistency and the scientific integrity of their reported results.
Practice Questions
Question 1 (2 marks)
A student records the length of a metal rod as 25.36 cm using a ruler with millimetre divisions. The manufacturer’s stated uncertainty in the ruler is ±0.05 cm.
(a) State the number of significant figures in the measurement.
(b) Explain why the recorded value is consistent with the precision of the measuring instrument.
Mark Scheme – Question 1 (2 marks)
(a) 1 mark: Identifies that 25.36 cm has 4 significant figures.
(b) 1 mark: Explains that the ruler allows readings to the nearest 0.01 cm, so the final digit (hundredths place) is estimated within the stated uncertainty (±0.05 cm), meaning the measurement appropriately reflects the instrument’s precision.
Question 2 (5 marks)
A student measures the current in a circuit as 0.524 A using a digital ammeter with a resolution of 0.001 A. The potential difference across the component is recorded as 5.3 V using a voltmeter with a resolution of 0.1 V.
(a) Calculate the resistance of the component.
(b) State the resistance to an appropriate number of significant figures.
(c) Justify your choice of the number of significant figures in your final answer.
Mark Scheme – Question 2 (5 marks)
(a) 1 mark: Correct formula used: R = V / I.
1 mark: Substitution and calculation: 5.3 / 0.524 = 10.11 Ω (accept 10.1 Ω).
(b) 1 mark: States final value as 10.1 Ω (3 significant figures).
(c) 2 marks total:
1 mark: Explains that the number of significant figures in the result must match the least precise measurement (here, voltage with 2 significant figures).
1 mark: States that the result is therefore rounded to 2 significant figures → 10 Ω, maintaining numerical consistency with the input data.
FAQ
Using too many significant figures gives a false impression of accuracy and misrepresents the reliability of your data. It suggests a level of precision the measuring instrument cannot achieve.
In physics reports and exams, excessive digits can be penalised because it shows poor understanding of uncertainty and precision.
To maintain credibility:
Match the number of significant figures to the least precise measurement.
Avoid quoting results like 4.987654 N when your force meter only measures to 0.01 N.
When performing calculations involving multiple measured quantities, the final result must reflect the least precise data.
Follow these rules:
Addition/Subtraction: Match the least number of decimal places.
Multiplication/Division: Match the least number of significant figures.
This ensures the result does not appear more precise than the least reliable input, maintaining numerical consistency throughout the analysis.
Yes, cumulative rounding errors can distort results, particularly in multi-step calculations. Each premature rounding introduces a small deviation that compounds with further operations.
To minimise this:
Keep unrounded values in your calculator for all intermediate steps.
Round only at the final stage.
Clearly state the number of significant figures used in the final answer.
This approach preserves numerical integrity and ensures reported values align with expected experimental accuracy.
Trailing zeros convey the precision of a measurement. For example:
3.2 × 10³ indicates two significant figures.
3.20 × 10³ indicates three significant figures.
Scientific notation clarifies ambiguity that occurs in whole numbers (e.g., 3200). Writing 3.200 × 10³ makes it clear that the value is known to four significant figures, directly linking precision to the number of digits reported.
Digital instruments often display more digits than are meaningful. The last displayed digit usually represents the uncertain digit, not an exact value.
To interpret correctly:
Treat the smallest displayed unit as the resolution.
The uncertainty is typically ±1 in the last digit.
Do not report digits beyond those shown, even if the display appears more precise.
Recognising which digits are significant helps avoid overstating precision when quoting results from digital devices.
