
OCR Specification focus:
‘Identify anomalies in experimental measurements, distinguishing them from expected variation within the data set.’
Experimental data in physics are rarely perfect. Identifying anomalies—measurements that deviate from expected trends—is vital for ensuring data integrity, reliability, and accurate scientific conclusions.
Understanding Anomalies
An anomaly is a measurement that falls outside the expected range of variation due to random or systematic errors, suggesting it may not represent the true behaviour of the system being investigated. Recognising anomalies allows physicists to assess whether data accurately reflect physical relationships or if experimental issues have occurred.
Anomaly: A data point that significantly deviates from the pattern of the rest of the data and cannot be explained by expected random variation.
In physics investigations, identifying such values is crucial because anomalous data can distort calculations of means, gradients, or derived constants. They may also reveal issues with apparatus, procedures, or human error.
Sources of Anomalies
Anomalies can arise from several causes:
Human error — such as misreading scales, recording incorrect values, or timing mistakes.
Equipment malfunction — e.g. a faulty sensor, parallax error in measurement, or calibration drift.
Environmental fluctuations — such as temperature or air pressure changes affecting readings.
Poor experimental control — where variables were not kept constant as intended.
Random and Systematic Errors
To correctly identify anomalies, it is essential to distinguish between random errors (which cause unpredictable scatter) and systematic errors (which shift all results in one direction).
Random errors contribute to the natural spread of data around a mean value; they are unavoidable but can be reduced by repetition.
Systematic errors cause consistent bias, often indicating that apparatus calibration or method design is flawed.
Random Error: An unpredictable fluctuation that affects individual measurements differently each time they are made.
Systematic Error: A consistent deviation caused by bias in measurement or experimental design.
A true anomaly stands apart from this expected scatter and does not fit the overall data trend.
Identifying Anomalies in Data Sets
Recognising anomalies involves comparing each data point against the overall pattern or expected theoretical behaviour.
1. Visual Inspection
Plotting data on a graph is the most immediate method. If one point lies well off the line of best fit, it may be an anomaly.
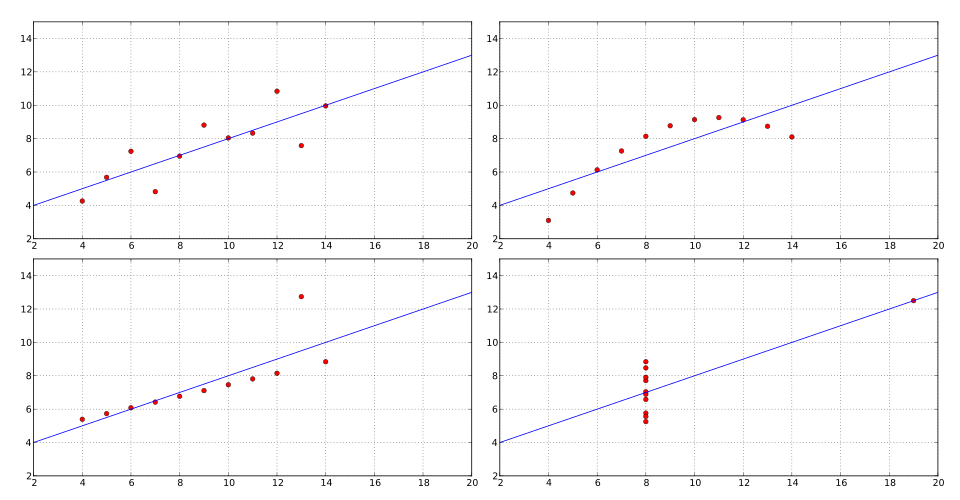
Scatterplot with fitted line illustrating an outlier that lies far from the main data trend. The panel highlights how an outlier can affect the perceived relationship and the fitted line. Other panels on the source page show additional configurations not required by the syllabus. Source.
This graphical approach quickly highlights discrepancies and allows for visual interpretation of the data’s consistency.
2. Statistical Analysis
For more quantitative identification:
Calculate the mean and standard deviation of repeated measurements.
Values lying more than two or three standard deviations from the mean are typically considered anomalous.
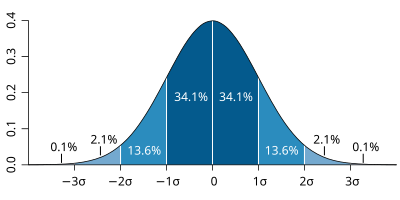
Normal distribution with standard deviation intervals shaded and labelled. Use the ±2σ to ±3σ ranges as an objective threshold to flag potential anomalous results. The colour bands reinforce how probability rapidly diminishes outside these regions. Source.
EQUATION
—-----------------------------------------------------------------
Standard Deviation (σ) = √[(Σ(x − x̄)²) / (n − 1)]
x = individual measurement (unit varies)
x̄ = mean value (unit matches x)
n = number of measurements (no unit)
σ = measure of data spread (unit matches x)
—-----------------------------------------------------------------
Statistical criteria prevent subjective decisions and ensure objectivity when identifying outliers in experimental data.
3. Comparison with Theoretical Expectations
Anomalies can also be detected by comparing experimental results to predicted values derived from theory or known constants. If the result differs beyond the combined uncertainty range, it is likely anomalous.
4. Consistency Between Repeats
Repeated measurements that show wide variation may contain one or more anomalous readings. The consistent grouping of most results around a common value makes outliers stand out clearly.
Distinguishing Anomalies from Expected Variation
It is essential to differentiate anomalies from legitimate variations due to measurement uncertainty.
If a result falls within the expected error margin, it should not be treated as anomalous.
Only when a data point exceeds expected variation by a clear margin should it be labelled an anomaly.
EQUATION
—-----------------------------------------------------------------
Percentage Uncertainty = (Absolute Uncertainty / Measured Value) × 100%
Absolute Uncertainty = Half the range of repeated measurements or manufacturer’s quoted value
—-----------------------------------------------------------------
By comparing this uncertainty range to the deviation of the suspect point, students can objectively decide whether it is anomalous.
Handling Anomalies in Experiments
Once identified, the correct approach to dealing with anomalies is vital:
Do not delete anomalous results automatically. They must first be investigated to determine cause.
Repeat the measurement if possible, ensuring improved control of variables and careful technique.
Record and report all data, including anomalies, clearly labelled in tables or graphs. Transparency maintains scientific integrity.
Discuss potential reasons for anomalies in evaluation sections, relating them to specific procedural or instrumental issues.
Validity: The degree to which results accurately reflect the quantity being measured, free from bias or interference.
Reliability: The consistency of results when repeated under the same conditions.
Correctly identifying anomalies enhances both validity and reliability, demonstrating awareness of data quality and methodological rigour.
Role of Anomalies in Scientific Practice
Anomalies are not always errors; sometimes, they signal new discoveries or overlooked physical effects. Historical examples, such as discrepancies in Mercury’s orbit leading to Einstein’s General Relativity, show how investigating anomalies can advance science. However, in A-Level contexts, anomalies more commonly reveal experimental inaccuracies rather than fundamental new physics.
Recording and Reporting Anomalies
When presenting data:
Clearly indicate anomalous points with a circle or notation on graphs.
State in analysis or evaluation sections that the point was identified and explain the reasoning.
Avoid using anomalous results when calculating means or gradients unless justified.
Reference the anomaly when discussing uncertainties, linking its identification to data evaluation and overall confidence in results.
Proper identification and treatment of anomalies demonstrate scientific skill and critical analysis, core expectations of the OCR A-Level Physics practical assessment. Recognising that some data will vary naturally while others deviate unacceptably is central to experimental integrity and the accurate validation of results.
Practice Questions
Question 1 (2 marks)
A student collects data for an experiment investigating the extension of a spring. One of the recorded data points lies far from the trend shown by the rest of the results.
(a) Explain what is meant by an anomalous result and how the student should deal with it.
Mark scheme:
1 mark for correctly defining an anomalous result, e.g. "A result that does not fit the general pattern of the data or is outside the expected range of variation."
1 mark for describing correct handling, e.g. "The student should repeat the measurement or check for errors rather than simply removing the result."
Question 2 (5 marks)
A student performs an experiment to determine the acceleration due to gravity by timing the fall of a small ball. Five time measurements are recorded for a fixed drop height. One of the times is much larger than the others.
(a) Explain how the student could identify whether this reading is an anomaly.
(b) Discuss two possible causes of the anomalous reading.
(c) Describe how the student should treat this anomalous result when analysing the data.
Mark scheme:
(a) 2 marks:
1 mark for stating that the student should compare the reading with the mean and check if it lies significantly outside the range of other readings or expected uncertainty.
1 mark for noting that values more than two or three standard deviations from the mean are usually considered anomalous.
(b) 2 marks:
1 mark for identifying each valid possible cause, such as human reaction time error, incorrect timing, or the ball not released cleanly.
1 mark for describing the cause in context, e.g. "Delayed reaction when starting the stopwatch caused an artificially large time."
(c) 1 mark:
1 mark for explaining that the result should not be used in the mean calculation unless repeated and confirmed, but must still be recorded and noted as anomalous in the report.
FAQ
An anomalous result is a measurement suspected to be invalid due to error, while an outlier is simply a value that lies far from the others in a data set.
All anomalous results are outliers, but not all outliers are anomalies. Sometimes, an outlier is valid and reflects genuine variation or new physical behaviour. Deciding which is which depends on understanding the experimental method and sources of uncertainty.
Repetition helps reveal whether a strange value is a one-off or part of a consistent pattern.
If the suspect value is not reproduced in repeats, it is likely an anomaly.
If repetition produces similar values, it suggests the result is genuine and may indicate an underlying effect or systematic issue.
Consistent repetition improves reliability and clarifies whether deviations are due to chance or genuine behaviour.
Yes, when investigated properly, anomalies can reveal flaws in method, calibration, or assumptions that would otherwise remain unnoticed.
Identifying an anomaly encourages:
Review of apparatus calibration.
Reconsideration of control variables.
Insight into hidden systematic errors.
Thus, anomalies can guide refinements that improve experimental accuracy in subsequent trials.
Scientific transparency requires that all data, including anomalous points, be shown and explained.
Recording anomalies:
Demonstrates awareness of uncertainty and data integrity.
Allows others to assess the validity of conclusions.
Provides evidence for further investigation if the anomaly recurs.
Excluding data without justification reduces reliability and breaches good scientific practice.
During peer review, anomalies draw attention to possible weaknesses or overlooked phenomena in experimental design.
If anomalies are well explained, they strengthen confidence in the researcher’s critical evaluation.
If ignored or poorly justified, they undermine the credibility of the findings.
Proper identification and discussion of anomalies are essential to maintaining integrity and reproducibility in scientific research.
